
Managerial Accounting
3rd Edition
ISBN: 9780077826482
Author: Stacey M Whitecotton Associate Professor, Robert Libby, Fred Phillips Associate Professor
Publisher: McGraw-Hill Education
expand_more
expand_more
format_list_bulleted
Videos
Textbook Question
Chapter 13, Problem 8E
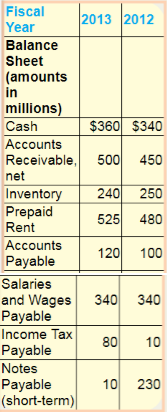
Computing and Interpreting
Cintas Corporation is the largest uniform supplier in North America. Selected information from its annual report follows. For the 2013 fiscal year, the company reported sales revenue of $43 billion and Cost of Goods Sold of $25 billion.
Required:
Assuming that all sales are on credit, compute the
Expert Solution & Answer
Want to see the full answer?
Check out a sample textbook solution
Students have asked these similar questions
Calculate ratios related to how quickly the company pays its trade debt and how quickly it collects from its customers. These are known as Accounts Payable (AP) Turnover and Accounts Receivable (AR) Turnover. The formula for AP Turnover is: Cost of Goods Sold/average accounts payable. The formula for AR Turnover is: credit sales/average accounts receivable. Calculate the AP and AR Turnover for each of 2011-2014. Interpret your calculations: what does this information mean? How is the company doing?
1. Compute the following ratios for the comparative periods (2018 and 2019). The company used 365 days in its computation for some of the ratios. Show your solution.
d. Accounts Receivable Turnover Ratio
e. Average Collection Period
f. Inventory Turnover Ratio
g. Average Days in Inventory
h. Number of days in Operating Cycle
i. Debt to Total Assets Ratio
j. Debt to Equity Ratio
k. Times Interest Earned Ratio
l. Gross Profit Ratio
m. Profit Margin Ratio
n. Return on Assets
o. Return on Equity
p. Assets Turnover Ratio
Suppose the 2017 financial statements of 3M Company report net sales of $23.1 billion. Accounts receivable (net) are $3.40 billion at the beginning of the year and $3.54 billion at the end of the year.
Compute 3M Company's receivable turnover. (Round answer to 1 decimal place, e.g. 12.5.)
times
Accounts receivable turnover ratio
SHOW LIST OF ACCOUNTS
LINK TO TEXT
INTERACTIVE TUTORIAL
Compute 3M Company's average collection period for accounts receivable in days. (Round answer to 1 decimal place, e.g. 12.5. Use 365 days for calculation.)
Average collection period
days
Chapter 13 Solutions
Managerial Accounting
Ch. 13 - Prob. 1QCh. 13 - Prob. 2QCh. 13 - What is ratio analysis? Why is it useful?
Ch. 13 - What benchmarks are commonly used for interpreting...Ch. 13 - Prob. 5QCh. 13 - Why are some analyses called horizontal and others...Ch. 13 - Slow Cellar’s current ratio increased from 1.2 to...Ch. 13 - From last year to this year. Colossal Company’s...Ch. 13 - From last year to this year, Berry Barn reported...Ch. 13 - Prob. 10Q
Ch. 13 - Prob. 1MCCh. 13 - Prob. 2MCCh. 13 - Prob. 3MCCh. 13 - Prob. 4MCCh. 13 - Prob. 5MCCh. 13 - Prob. 6MCCh. 13 - Prob. 7MCCh. 13 - Prob. 8MCCh. 13 - Prob. 9MCCh. 13 - Prob. 1MECh. 13 - Prob. 2MECh. 13 - Prob. 3MECh. 13 - Prob. 4MECh. 13 - Prob. 5MECh. 13 - Prob. 6MECh. 13 - Prob. 7MECh. 13 - Prob. 8MECh. 13 - Prob. 9MECh. 13 - Prob. 10MECh. 13 - Prob. 11MECh. 13 - Prob. 12MECh. 13 - Prob. 13MECh. 13 - Prob. 14MECh. 13 - Prob. 1ECh. 13 - Prob. 2ECh. 13 - Prob. 3ECh. 13 - Prob. 4ECh. 13 - Prob. 5ECh. 13 - Prob. 6ECh. 13 - Prob. 7ECh. 13 - Computing and Interpreting Liquidity Ratios...Ch. 13 - Prob. 9ECh. 13 - Prob. 10ECh. 13 - Prob. 11ECh. 13 - Prob. 12ECh. 13 - Prob. 13ECh. 13 - Analyzing the Impact of Selected Transactions on...Ch. 13 - Prob. 15ECh. 13 - Prob. 1.1GAPCh. 13 - Prob. 1.2GAPCh. 13 - Prob. 2.1GAPCh. 13 - Prob. 2.2GAPCh. 13 - Prob. 2.3GAPCh. 13 - Prob. 2.4GAPCh. 13 - Prob. 2.5GAPCh. 13 - Prob. 2.6GAPCh. 13 - Prob. 2.7GAPCh. 13 - Prob. 2.8GAPCh. 13 - Prob. 3.1GAPCh. 13 - Prob. 3.2GAPCh. 13 - Prob. 3.3GAPCh. 13 - Prob. 4.1GAPCh. 13 - Prob. 4.2GAPCh. 13 - Prob. 4.3GAPCh. 13 - Prob. 5.1GAPCh. 13 - Prob. 5.2GAPCh. 13 - Prob. 5.3GAPCh. 13 - Prob. 5.4GAPCh. 13 - Prob. 6.1GAPCh. 13 - Prob. 6.2GAPCh. 13 - Prob. 7GAPCh. 13 - Prob. 1.1GBPCh. 13 - Prob. 1.2GBPCh. 13 - Prob. 2.1GBPCh. 13 - Prob. 2.2GBPCh. 13 - Prob. 2.3GBPCh. 13 - Prob. 2.4GBPCh. 13 - Prob. 2.5GBPCh. 13 - Prob. 2.6GBPCh. 13 - Prob. 2.7GBPCh. 13 - Prob. 2.8GBPCh. 13 - Prob. 3.1GBPCh. 13 - Prob. 3.2GBPCh. 13 - Prob. 3.3GBPCh. 13 - Prob. 4.1GBPCh. 13 - Prob. 4.2GBPCh. 13 - Prob. 4.3GBPCh. 13 - Prob. 5.1GBPCh. 13 - Prob. 5.2GBPCh. 13 - Prob. 5.3GBPCh. 13 - Prob. 5.4GBPCh. 13 - Prob. 6.1GBPCh. 13 - Prob. 6.2GBPCh. 13 - Prob. 7GBP
Knowledge Booster


Learn more about
Need a deep-dive on the concept behind this application? Look no further. Learn more about this topic, accounting and related others by exploring similar questions and additional content below.Similar questions
- The comparative financial statements of Bettancort Inc. are as follows. The market price of Bettancort Inc. common stock was $71.25 on December 31, 2014. InstructionsDetermine the following measures for 2014, rounding to one decimal place:1. a.Working capital b. Current ratio c. Quick ratiod. Accounts receivable turnovere. Number of days' sales in receivablesf. Inventory turnoverg. Number of days' sales in inventoryh. Ratio of fixed assets to long-term liabilitiesi. Ratio of liabilities to stockholders’ equityj. Number of times interest charges are earnedk. Number of times preferred dividends are earned2. a. Ratio of net sales to assetsb. Rate earned on total assetsc. Rate earned on stockholders' equityd. Rate earned on common stockholders' equitye. Earnings per share on common stockf. Price-earnings ratiog. Dividends per share of common stockh. Dividend yieldarrow_forwardSelected ratios of Company X are shown below: Inventory turnover Days' sales uncollected Days' purchases in accounts payable Total asset turnover Equity ratio Times interest earned 2021 5.3 32.4 21.0 2.6 0.8 N.A. 2020 7.1 18.3 20.0 2.5 0.8 N.A. Using the financial ratios provided, analyse the performance of Company X in 2021 compared to the previous year.arrow_forwardThe Cullumber Supply Company reported the following information for 2017. Prepare a common-size income statement for the year ended June 30, 2017. (Round answers to 1 decimal place, e.g. 52.7%.) Cullumber Supply CompanyIncome Statement for the Fiscal Year Ended June 30, 2017($ thousands) % of Net Sales Net sales $2,111,000 enter percentages of net sales % Cost of goods sold 1,464,000 enter percentages of net sales % Selling and administrative expenses 312,200 enter percentages of net sales % Nonrecurring expenses 27,600 enter percentages of net sales % Earnings before interest, taxes, depreciation, and amortization (EBITDA) $307,200 enter percentages of net sales % Depreciation 117,000 enter percentages of net sales % Earnings before interest and taxes (EBIT) 190,200 enter percentages of net sales % Interest expense 118,600 enter percentages of net sales % Earnings before taxes (EBT)…arrow_forward
- Access the February 21, 2017, filing of the December 31, 2016, 10-K report of The Hershey Company (ticker: HSY) at SEC.gov and complete the following requirements. Required Compute or identify the following profitability ratios of Hershey for its years ending December 31, 2016, and December 31, 2015. Interpret its profitability using the results obtained for these two years. 1. Profit margin ratio (round the percent to one decimal). 2. Gross profit ratio (round the percent to one decimal). 3. Return on total assets (round the percent to one decimal). (Total assets at year-end 2014 were $5,622,870 in thousands.) 4. Return on common stockholders’ equity (round the percent to one decimal). (Total shareholders’ equity at year-end 2014 was $1,519,530 in thousands.) 5. Basic net income per common share (round to the nearest cent).arrow_forwardI need assistance in finding the ratios for the following (see attached sheets). Calculate the following financial ratios for 2016 and 2017 10. Average collection period 11. Inventory turnover ( 2015, inventory = $1,540.9 million) 12. Days' sales in inventoryarrow_forwardRequired: Use an Excel file to answer the following questions. Compute the following ratios for the companies’ 2014 fiscal years. (Use formulas): Current ratio Average days to sell inventory. (Use average inventory.) Debt to assets ratio. Return on investment. (Use average assets and use “earnings from continuing operations” rather than “net earnings.”) Gross margin percentage. Asset turnover. (Use average assets.) Net margin. (Use “earnings from continuing operations” rather than “net earnings.”) Plant assets to long-term debt ratio. Which company appears to be more profitable? Explain your answer and identify which ratio(s) from Requirement a you used to reach your conclusion. Which company appears to have the higher level of financial risk? Explain your answer and identify which ratio(s) from Requirement a you used to reach your conclusion. Which company appears to be charging higher prices for its goods? Explain your answer and identify which ratio(s) from Requirement a you…arrow_forward
- (Ratio Computations and Analysis) Prior Company’s condensed financial statements provide the following information. Check the below image for information. Instructions(a) Determine the following for 2017.(1) Current ratio at December 31.(2) Acid-test ratio at December 31.(3) Accounts receivable turnover.(4) Inventory turnover.(5) Return on assets.(6) Profit margin on sales.(b) Prepare a brief evaluation of the financial condition of Prior Company and of the adequacy of its profits.arrow_forwardFind the following financial ratios for LVMH Moet Hennessy Louis Vuitton SA (use year-end figures rather than average values where appropriate) (Round your answers to 2 decimal places (e.g., 32.16).) : 2015 2016 Short-term solvency ratios: Current ratio Quick ratio Cash ratio Asset utilization ratios: Total asset turnover Inventory turnover Receivables turnover Long-term solvency ratios: Total debt ratio Debt–equity ratio Equity multiplier Times interest earned ratio Profitability ratios: Profit margin % % Return on assets % % Return on equity % %arrow_forwardThe following data are taken from the financial statements of Colby Company. Accounts receivable (net), end of year Net sales on account Terms for all sales are 1/10, n/45 Accounts Receivable turnover Average collection period (b) 2022 $550,000 2022 2021 4,300,000 4,000,000 7.9 times $540,000 2021 7.5 times 46.2 days 48.7 days What conclusions about the management of accounts receivable can be drawn from the accounts receivable turnover and the average collections period.arrow_forward
- Make Analysis into an evaluation of the firm’s liquidity, activity, debt, profitability and market ratios. Historical and Industry Average Ratios HTS Software , Inc. Industry Ratio 2010 2011 2011 Liquidity Ratios Current Ratio 2.6 2.08 2.7 Quick Ratio 1.8 1.32 1.75 Activity Ratios Inventory Turnover 4.5 3.00 4.7 Average Collection Period 40days 53days 42 days Total Asset Turnover 1.2 0.80 1 Debt Ratios Debt Ratio 20% 28% 21% Times Interest Earned 9 6 8.9 Profitability Ratios Gross Profit Margin 43% 43% 44% Operating Profit Margin 30% 26% 32% Net Profit Margin 20% 17% 21% Return on total assets 12% 14% 13% Return on Equity 15% 19% 16% Market Ratios Price/Earnings Ratio 7.3 4.4 8arrow_forward1. Compute the following ratios for the comparative periods (2018 and 2019). The company used 365 days in its computation for some of the ratios. Show your solution. a. Working Capital b. Current Ratio c. Acid Test Ratio d. Accounts Receivable Turnover Ratio e. Average Collection Period f. Inventory Turnover Ratio g. Average Days in Inventory h. Number of days in Operating Cycle i. Debt to Total Assets Ratio j. Debt to Equity Ratio k. Times Interest Earned Ratio l. Gross Profit Ratio m. Profit Margin Ratio n. Return on Assets o. Return on Equity p. Assets Turnover Ratioarrow_forwardOperating data for Flounder Corp. are presented below. 2017 2016 Sales revenue $825,400 $628,400 Cost of goods sold 527,300 412,700 Selling expenses 125,600 76,800 Administrative expenses 75,500 52,800 Income tax expense 36,700 29,200 Net income 60,300 56,900 Prepare a schedule showing a vertical analysis for 2017 and 2016. (Round percentages to 1 decimal place, e.g. 12.1%.)arrow_forward
arrow_back_ios
SEE MORE QUESTIONS
arrow_forward_ios
Recommended textbooks for you
 Managerial Accounting: The Cornerstone of Busines...AccountingISBN:9781337115773Author:Maryanne M. Mowen, Don R. Hansen, Dan L. HeitgerPublisher:Cengage Learning
 Financial Accounting: The Impact on Decision Make...AccountingISBN:9781305654174Author:Gary A. Porter, Curtis L. NortonPublisher:Cengage Learning
Managerial Accounting: The Cornerstone of Busines...
Accounting
ISBN:9781337115773
Author:Maryanne M. Mowen, Don R. Hansen, Dan L. Heitger
Publisher:Cengage Learning
Financial Accounting: The Impact on Decision Make...
Accounting
ISBN:9781305654174
Author:Gary A. Porter, Curtis L. Norton
Publisher:Cengage Learning
Financial ratio analysis; Author: The Finance Storyteller;https://www.youtube.com/watch?v=MTq7HuvoGck;License: Standard Youtube License