Videos
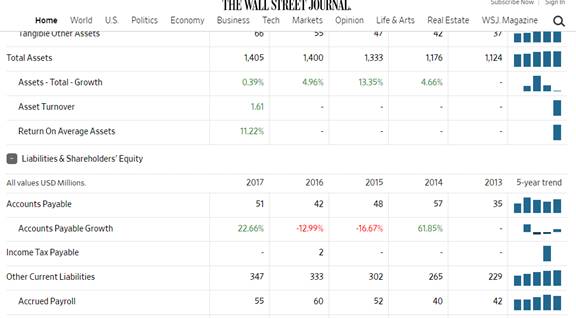
To get an overall picture of each company's capital structure, it is helpful to look at a the Key Ratios screen and then select the Financial Health tab. Common size balance sheet data are provided over a 10-year period. What, if any, are the major trends that emerge when you're looking at those data? Do those companies tend to have relatively high or relatively low levels of debt? Do these companies have significant levels of current liabilities? Have their capital structures changed over time?
Use online resources to work on this chapter's questions. Please note that website information changes over time, and these changes may limit your ability to answer some of these questions.
This chapter provides an overview of the effects of leverage and describes the process that firms use to determine their optimal capital structure. The chapter also indicates that capital structures tend to vary across industries and across countries. If you are interested in exploring these differences in more detail, the Morningstar website provides information about the capital structures of each of the companies it follows. The following discussion questions demonstrate how we can use this information to evaluate the capital structures for four restaurant companies: Cheesecake Factory (CAKE), Chipotle Mexican Grill (CMG), Ruby Tuesday (RT), and O'Charley's Inc. (CHUX).
Want to see the full answer?
Check out a sample textbook solution
Chapter 13 Solutions
Fundamentals of Financial Management, Concise Edition (MindTap Course List)


- Analyze the financial statements of the company to you in terms of:1. Solvency Ratio: *Equity Ratio 2. Asset Management Ratio: *Invetory Turnover Ratio *Fixed Asset Turnover Ratio *Total Asset Turnover Ratio 3. Debt Management Ratio: *Time Interest Earned Ratio 4. Profitability Ratio: *Operating Margin *Return on Total Assets *Return on Common Equity.…arrow_forwardThe image uploaded is the calculation of Access Bank's Profitability ratios, shorter liquidity ratios, long-term liquidity ratios, and investment ratios for 2020, 2021, 2022. A base year of 2019 was also added. Evaluate the financial performance by comparing the three (3) years' financial performance that is 2020, 2021, and 2022 I have provided in the table with the base year.arrow_forwardSelected financial data for Surf City and Paradise Falls are as follows:Required:1. Calculate the debt to equity ratio for Surf City and Paradise Falls for the most recent year. Which company has the higher ratio?2. Calculate the return on assets for Surf City and Paradise Falls. Which company appears more profitable?3. Calculate the times interest earned ratio for Surf City and Paradise Falls. Which company is better able to meet interest payments as they become due?arrow_forward
- Guide Questions: 1. Is ABC, Inc. profitable? 2. Is the company's financial performance improving based on the two year data presented? 3. Is the company heavily financed by debt or equity? 4. Provide interpretation of the Horizontal and Vertical Analysis and Ratio Analysis (A). 5. From the computation (A), assuming that there is no pandemic, How do you see ABC, INC.? Is it profitable? Good for long term investment? Short term investment? Is the company still existing?arrow_forwardDiscuss on Credit Risk of Nordstrom Time-series analysis Analyze credit risk in the past and current years (You may obtain information about firms’ credit ratings from financial articles as well); trend analysis Cross-sectional analysis - How do you think about current and future firm value? Discuss on Profitability: - Time-series analysis Analyze profitability in the past and current years; Can you find patterns or trends over the three years? Cross-sectional analysisarrow_forwardWhich of the following is the correct explanation for the purpose of financial risk ratios? Select one: a. They show the relative levels of liquid assets of the company. b. They show the relative proportion of debt items with respect to shareholders' equity or total capital. c. They show the profitability of the company over a specific period of time. d. They show the probability of whether the company will face problems in operations.arrow_forward
- I uploaded pictures for problem 17-4B. I am trying to figure out the 1. Working Capital 2. Current Ratio 3. Quick Ratio 8. Ratio of Fixed Assets to long-term Liabilities 9. Ratio of Liabilities to Stockholders Equity 10. Times interest earned 11. Asset Turnover 13. Return on Stockholders Equity 14. Return on Common Stockhholders Equity 15. Earnings per share on Common stock 16. Price Earnings Ratio 17. Dividends per share of Common Stockarrow_forwardWhich of the following is the correct explanation for the purpose of financial risk ratios? Select one: O a. They show the relative proportion of debt items with respect to shareholders' equity or total capital. b. They show the profitability of the company over a specific period of time. c. They show the probability of whether the company will face problems in operations. O d. They show the relative levels of liquid assets of the company.arrow_forwardFinancial Statement Analysis tells you if your company is on the right track. Are you growing, making more money? Find out why the Liquidity, Leverage, Profitability, and Cash Flow Ratios are so important to a company's survival? List at least '1' for each category, describing how it is calculated, and what it means.arrow_forward
- This question requires an analysis of financial statements from annual reports of companies. Complete the analysis by incorporating the three dimensions of ratios which are liquidity, profitability, and solvency. As an investor, why you prefer this company to invest in? based on ratios and horizontal & vertical analysis of company the company that i’ve been made, justify your answer.arrow_forwardHow does Financial Leverage, Debt/Equity Ratio, and Equity Multiplier determine a firm's financial profitability? What should the numbers look like to determine profitable / unprofitable over three yearsarrow_forwardUse information from the balance sheet and income statement to calculate the following financial ratios and the market value added (MVA). Whenever balance sheet numbers are used to calculate financial ratios, please ensure that you use the average of the 2019 and 2020 numbers in your calculation. To calculate MVA, you can assume that the average book value number for common stock and paid-in-surplus is the amount that the shareholders initially invested in the company.arrow_forward
 Fundamentals of Financial Management, Concise Edi...FinanceISBN:9781305635937Author:Eugene F. Brigham, Joel F. HoustonPublisher:Cengage Learning
 Fundamentals of Financial Management, Concise Edi...FinanceISBN:9781285065137Author:Eugene F. Brigham, Joel F. HoustonPublisher:Cengage Learning
 EBK CONTEMPORARY FINANCIAL MANAGEMENTFinanceISBN:9781337514835Author:MOYERPublisher:CENGAGE LEARNING - CONSIGNMENT