
APPLIED STAT.IN BUS.+ECONOMICS
6th Edition
ISBN: 9781259957598
Author: DOANE
Publisher: RENT MCG
expand_more
expand_more
format_list_bulleted
Videos
Textbook Question
Chapter 12.6, Problem 29SE
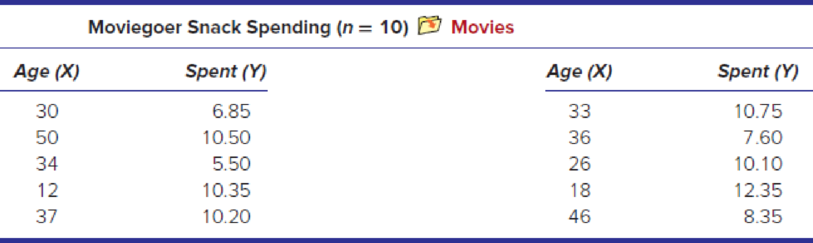
Instructions for exercises 12.29–12.31: (a) Use Excel’s Data Analysis > Regression (or MegaStat or Minitab) to obtain regression estimates. (b) Interpret the 95 percent confidence interval for the slope. Does it contain zero? (c) Interpret the t test for the slope and its p-value. (d) Interpret the F statistic. (e) Verify that the p-value for F is the same as for the slope’s t statistic, and show that t2 = F. (f) Describe the fit of the regression.
Expert Solution & Answer
Want to see the full answer?
Check out a sample textbook solution
Students have asked these similar questions
1.2.17. (!) Let G,, be the graph whose vertices are the permutations of (1,..., n}, with
two permutations a₁, ..., a,, and b₁, ..., b, adjacent if they differ by interchanging a pair
of adjacent entries (G3 shown below). Prove that G,, is connected.
132
123
213
312
321
231
You are planning an experiment to determine the effect of the brand of gasoline and the weight of a car on gas mileage measured in miles per gallon. You will use a single test car, adding weights so that its total weight is 3000, 3500, or 4000 pounds. The car will drive on a test track at each weight using each of Amoco, Marathon, and Speedway gasoline. Which is the best way to organize the study?
Start with 3000 pounds and Amoco and run the car on the test track. Then do 3500 and 4000 pounds. Change to Marathon and go through the three weights in order. Then change to Speedway and do the three weights in order once more.
Start with 3000 pounds and Amoco and run the car on the test track. Then change to Marathon and then to Speedway without changing the weight. Then add weights to get 3500 pounds and go through the three gasolines in the same order.Then change to 4000 pounds and do the three gasolines in order again.
Choose a gasoline at random, and run the car with this gasoline at…
AP1.2 A child is 40 inches tall, which places her at the 90th percentile of all children of similar age. The heights for children of this age form an approximately Normal distribution with a mean of 38 inches. Based on this information, what is the standard deviation of the heights of all children of this age?
0.20 inches (c) 0.65 inches (e) 1.56 inches
0.31 inches (d) 1.21 inches
Chapter 12 Solutions
APPLIED STAT.IN BUS.+ECONOMICS
Ch. 12.1 - For each sample, do a test for zero correlation....Ch. 12.1 - Instructions for Exercises 12.2 and 12.3: (a) Make...Ch. 12.1 - Prob. 3SECh. 12.1 - Prob. 4SECh. 12.1 - Instructions for exercises 12.412.6: (a) Make a...Ch. 12.1 - Prob. 6SECh. 12.2 - (a) Interpret the slope of the fitted regression...Ch. 12.2 - (a) Interpret the slope of the fitted regression...Ch. 12.2 - Prob. 9SECh. 12.2 - (a) Interpret the slope of the fitted regression...
Ch. 12.2 - (a) Interpret the slope of the fitted regression...Ch. 12.3 - Prob. 12SECh. 12.3 - Prob. 13SECh. 12.3 - The regression equation Credits = 15.4 .07 Work...Ch. 12.3 - Below are fitted regressions for Y = asking price...Ch. 12.3 - Refer back to the regression equation in exercise...Ch. 12.3 - Refer back to the regression equation in exercise...Ch. 12.4 - Instructions for exercises 12.18 and 12.19: (a)...Ch. 12.4 - Instructions for exercises 12.18 and 12.19: (a)...Ch. 12.4 - Instructions for exercises 12.2012.22: (a) Use...Ch. 12.4 - Instructions for exercises 12.2012.22: (a) Use...Ch. 12.4 - Instructions for exercises 12.2012.22: (a) Use...Ch. 12.5 - Instructions for exercises 12.23 and 12.24: (a)...Ch. 12.5 - Instructions for exercises 12.23 and 12.24: (a)...Ch. 12.5 - A regression was performed using data on 32 NFL...Ch. 12.5 - A regression was performed using data on 16...Ch. 12.6 - Below is a regression using X = home price (000),...Ch. 12.6 - Below is a regression using X = average price, Y =...Ch. 12.6 - Instructions for exercises 12.2912.31: (a) Use...Ch. 12.6 - Instructions for exercises 12.2912.31: (a) Use...Ch. 12.6 - Instructions for exercises 12.2912.31: (a) Use...Ch. 12.7 - Refer to the Weekly Earnings data set below. (a)...Ch. 12.7 - Prob. 33SECh. 12.8 - Prob. 34SECh. 12.8 - Prob. 35SECh. 12.9 - Calculate the standardized residual ei and...Ch. 12.9 - Prob. 37SECh. 12.9 - An estimated regression for a random sample of...Ch. 12.9 - An estimated regression for a random sample of...Ch. 12.9 - Prob. 40SECh. 12.9 - Prob. 41SECh. 12.9 - Prob. 42SECh. 12.9 - Prob. 43SECh. 12.11 - Prob. 44SECh. 12.11 - Prob. 45SECh. 12 - (a) How does correlation analysis differ from...Ch. 12 - (a) What is a simple regression model? (b) State...Ch. 12 - (a) Explain how you fit a regression to an Excel...Ch. 12 - (a) Explain the logic of the ordinary least...Ch. 12 - (a) Why cant we use the sum of the residuals to...Ch. 12 - Prob. 6CRCh. 12 - Prob. 7CRCh. 12 - Prob. 8CRCh. 12 - Prob. 9CRCh. 12 - Prob. 10CRCh. 12 - Prob. 11CRCh. 12 - Prob. 12CRCh. 12 - (a) What is heteroscedasticity? Identify its two...Ch. 12 - (a) What is autocorrelation? Identify two main...Ch. 12 - Prob. 15CRCh. 12 - Prob. 16CRCh. 12 - (a) What is a log transform? (b) What are its...Ch. 12 - (a) When is logistic regression needed? (b) Why...Ch. 12 - Prob. 46CECh. 12 - Prob. 47CECh. 12 - Prob. 48CECh. 12 - Instructions: Choose one or more of the data sets...Ch. 12 - Prob. 50CECh. 12 - Prob. 51CECh. 12 - Prob. 52CECh. 12 - Prob. 53CECh. 12 - Instructions: Choose one or more of the data sets...Ch. 12 - Instructions: Choose one or more of the data sets...Ch. 12 - Instructions: Choose one or more of the data sets...Ch. 12 - Prob. 57CECh. 12 - Prob. 58CECh. 12 - Prob. 59CECh. 12 - Prob. 60CECh. 12 - Prob. 61CECh. 12 - Prob. 62CECh. 12 - Prob. 63CECh. 12 - Prob. 64CECh. 12 - Prob. 65CECh. 12 - In the following regression, X = weekly pay, Y =...Ch. 12 - Prob. 67CECh. 12 - In the following regression, X = total assets (...Ch. 12 - Prob. 69CECh. 12 - Below are percentages for annual sales growth and...Ch. 12 - Prob. 71CECh. 12 - Prob. 72CECh. 12 - Prob. 73CECh. 12 - Simple regression was employed to establish the...Ch. 12 - Prob. 75CECh. 12 - Prob. 76CECh. 12 - Prob. 77CECh. 12 - Below are revenue and profit (both in billions)...Ch. 12 - Below are fitted regressions based on used vehicle...Ch. 12 - Below are results of a regression of Y = average...Ch. 12 - Prob. 81CE
Knowledge Booster


Learn more about
Need a deep-dive on the concept behind this application? Look no further. Learn more about this topic, statistics and related others by exploring similar questions and additional content below.Similar questions
- AP1.1 You look at real estate ads for houses in Sarasota, Florida. Many houses range from $200,000 to $400,000 in price. The few houses on the water, however, have prices up to $15 million. Which of the following statements best describes the distribution of home prices in Sarasota? The distribution is most likely skewed to the left, and the mean is greater than the median. The distribution is most likely skewed to the left, and the mean is less than the median. The distribution is roughly symmetric with a few high outliers, and the mean is approximately equal to the median. The distribution is most likely skewed to the right, and the mean is greater than the median. The distribution is most likely skewed to the right, and the mean is less than the median.arrow_forwardDuring busy political seasons, many opinion polls are conducted. In apresidential race, how do you think the participants in polls are generally selected?Discuss any issues regarding simple random, stratified, systematic, cluster, andconvenience sampling in these polls. What about other types of polls, besides political?arrow_forwardPlease could you explain why 0.5 was added to each upper limpit of the intervals.Thanksarrow_forward
- 28. (a) Under what conditions do we say that two random variables X and Y are independent? (b) Demonstrate that if X and Y are independent, then it follows that E(XY) = E(X)E(Y); (e) Show by a counter example that the converse of (ii) is not necessarily true.arrow_forward1. Let X and Y be random variables and suppose that A = F. Prove that Z XI(A)+YI(A) is a random variable.arrow_forward30. (a) What is meant by the term "product measur"? ANDarrow_forward
arrow_back_ios
SEE MORE QUESTIONS
arrow_forward_ios
Recommended textbooks for you
 MATLAB: An Introduction with ApplicationsStatisticsISBN:9781119256830Author:Amos GilatPublisher:John Wiley & Sons Inc
 Probability and Statistics for Engineering and th...StatisticsISBN:9781305251809Author:Jay L. DevorePublisher:Cengage Learning
 Statistics for The Behavioral Sciences (MindTap C...StatisticsISBN:9781305504912Author:Frederick J Gravetter, Larry B. WallnauPublisher:Cengage Learning
 Elementary Statistics: Picturing the World (7th E...StatisticsISBN:9780134683416Author:Ron Larson, Betsy FarberPublisher:PEARSON
 The Basic Practice of StatisticsStatisticsISBN:9781319042578Author:David S. Moore, William I. Notz, Michael A. FlignerPublisher:W. H. Freeman
 Introduction to the Practice of StatisticsStatisticsISBN:9781319013387Author:David S. Moore, George P. McCabe, Bruce A. CraigPublisher:W. H. Freeman
MATLAB: An Introduction with Applications
Statistics
ISBN:9781119256830
Author:Amos Gilat
Publisher:John Wiley & Sons Inc
Probability and Statistics for Engineering and th...
Statistics
ISBN:9781305251809
Author:Jay L. Devore
Publisher:Cengage Learning
Statistics for The Behavioral Sciences (MindTap C...
Statistics
ISBN:9781305504912
Author:Frederick J Gravetter, Larry B. Wallnau
Publisher:Cengage Learning
Elementary Statistics: Picturing the World (7th E...
Statistics
ISBN:9780134683416
Author:Ron Larson, Betsy Farber
Publisher:PEARSON
The Basic Practice of Statistics
Statistics
ISBN:9781319042578
Author:David S. Moore, William I. Notz, Michael A. Fligner
Publisher:W. H. Freeman
Introduction to the Practice of Statistics
Statistics
ISBN:9781319013387
Author:David S. Moore, George P. McCabe, Bruce A. Craig
Publisher:W. H. Freeman
Hypothesis Testing using Confidence Interval Approach; Author: BUM2413 Applied Statistics UMP;https://www.youtube.com/watch?v=Hq1l3e9pLyY;License: Standard YouTube License, CC-BY
Hypothesis Testing - Difference of Two Means - Student's -Distribution & Normal Distribution; Author: The Organic Chemistry Tutor;https://www.youtube.com/watch?v=UcZwyzwWU7o;License: Standard Youtube License