
APPLIED STAT.IN BUS.+ECONOMICS
6th Edition
ISBN: 9781259957598
Author: DOANE
Publisher: RENT MCG
expand_more
expand_more
format_list_bulleted
Concept explainers
Videos
Textbook Question
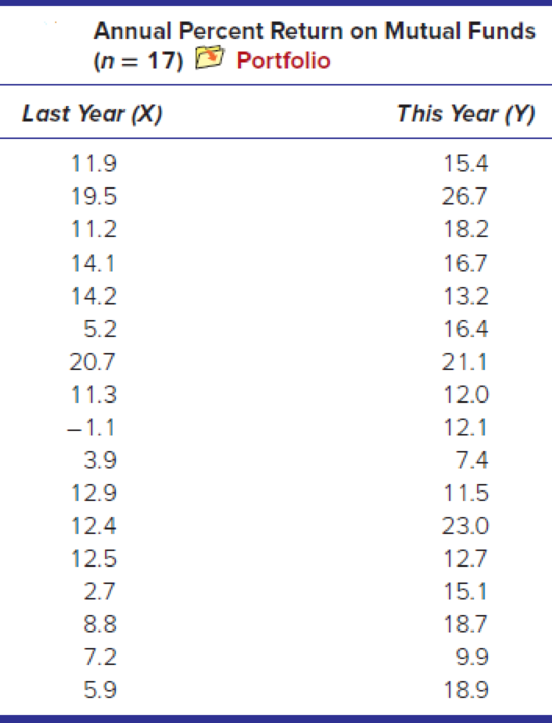
Chapter 12.1, Problem 5SE
Instructions for exercises 12.4–12.6: (a) Make a
12.5
Expert Solution & Answer
Want to see the full answer?
Check out a sample textbook solution
Students have asked these similar questions
A researcher is conducting a study to examine the relationship between age and agility. She recruited a sample of 50 participants, ranging in age from 20 – 65 years old, and asked them to perform a series of agility tests. Afterward, participants were given an average agility score, which was then used in a correlation analysis against participant age. The results of the study are as follows [r(50) = -0.97, p < 0.001]. Identify the correct interpretation below.
A. There is a non-significant, weak, negative correlation between age and agility, suggest that as age increases, agility decreases
B. There is a statistically significant, strong, negative correlation between age and agility, suggesting that as age increases, agility decreases
C. There is a non-significant, moderate, positive correlation between age and agility, suggesting that there is no relationship between these two variables
D. There is a statistically significant, strong positive correlation between age and…
Find the new data point (x,y) in which x=2 from the data points (1.3) and (4.12)
c) Show that the coefficient of determination, R², can also be obtained as the squared
correlation between actual Y values and the Y values estimated from the regression model
where Y is the dependent variable.
Note that the coefficient of correlation between Y and X is
Eyixi
r =
And also that ỹ = ŷ
(18.75)
Chapter 12 Solutions
APPLIED STAT.IN BUS.+ECONOMICS
Ch. 12.1 - For each sample, do a test for zero correlation....Ch. 12.1 - Instructions for Exercises 12.2 and 12.3: (a) Make...Ch. 12.1 - Prob. 3SECh. 12.1 - Prob. 4SECh. 12.1 - Instructions for exercises 12.412.6: (a) Make a...Ch. 12.1 - Prob. 6SECh. 12.2 - (a) Interpret the slope of the fitted regression...Ch. 12.2 - (a) Interpret the slope of the fitted regression...Ch. 12.2 - Prob. 9SECh. 12.2 - (a) Interpret the slope of the fitted regression...
Ch. 12.2 - (a) Interpret the slope of the fitted regression...Ch. 12.3 - Prob. 12SECh. 12.3 - Prob. 13SECh. 12.3 - The regression equation Credits = 15.4 .07 Work...Ch. 12.3 - Below are fitted regressions for Y = asking price...Ch. 12.3 - Refer back to the regression equation in exercise...Ch. 12.3 - Refer back to the regression equation in exercise...Ch. 12.4 - Instructions for exercises 12.18 and 12.19: (a)...Ch. 12.4 - Instructions for exercises 12.18 and 12.19: (a)...Ch. 12.4 - Instructions for exercises 12.2012.22: (a) Use...Ch. 12.4 - Instructions for exercises 12.2012.22: (a) Use...Ch. 12.4 - Instructions for exercises 12.2012.22: (a) Use...Ch. 12.5 - Instructions for exercises 12.23 and 12.24: (a)...Ch. 12.5 - Instructions for exercises 12.23 and 12.24: (a)...Ch. 12.5 - A regression was performed using data on 32 NFL...Ch. 12.5 - A regression was performed using data on 16...Ch. 12.6 - Below is a regression using X = home price (000),...Ch. 12.6 - Below is a regression using X = average price, Y =...Ch. 12.6 - Instructions for exercises 12.2912.31: (a) Use...Ch. 12.6 - Instructions for exercises 12.2912.31: (a) Use...Ch. 12.6 - Instructions for exercises 12.2912.31: (a) Use...Ch. 12.7 - Refer to the Weekly Earnings data set below. (a)...Ch. 12.7 - Prob. 33SECh. 12.8 - Prob. 34SECh. 12.8 - Prob. 35SECh. 12.9 - Calculate the standardized residual ei and...Ch. 12.9 - Prob. 37SECh. 12.9 - An estimated regression for a random sample of...Ch. 12.9 - An estimated regression for a random sample of...Ch. 12.9 - Prob. 40SECh. 12.9 - Prob. 41SECh. 12.9 - Prob. 42SECh. 12.9 - Prob. 43SECh. 12.11 - Prob. 44SECh. 12.11 - Prob. 45SECh. 12 - (a) How does correlation analysis differ from...Ch. 12 - (a) What is a simple regression model? (b) State...Ch. 12 - (a) Explain how you fit a regression to an Excel...Ch. 12 - (a) Explain the logic of the ordinary least...Ch. 12 - (a) Why cant we use the sum of the residuals to...Ch. 12 - Prob. 6CRCh. 12 - Prob. 7CRCh. 12 - Prob. 8CRCh. 12 - Prob. 9CRCh. 12 - Prob. 10CRCh. 12 - Prob. 11CRCh. 12 - Prob. 12CRCh. 12 - (a) What is heteroscedasticity? Identify its two...Ch. 12 - (a) What is autocorrelation? Identify two main...Ch. 12 - Prob. 15CRCh. 12 - Prob. 16CRCh. 12 - (a) What is a log transform? (b) What are its...Ch. 12 - (a) When is logistic regression needed? (b) Why...Ch. 12 - Prob. 46CECh. 12 - Prob. 47CECh. 12 - Prob. 48CECh. 12 - Instructions: Choose one or more of the data sets...Ch. 12 - Prob. 50CECh. 12 - Prob. 51CECh. 12 - Prob. 52CECh. 12 - Prob. 53CECh. 12 - Instructions: Choose one or more of the data sets...Ch. 12 - Instructions: Choose one or more of the data sets...Ch. 12 - Instructions: Choose one or more of the data sets...Ch. 12 - Prob. 57CECh. 12 - Prob. 58CECh. 12 - Prob. 59CECh. 12 - Prob. 60CECh. 12 - Prob. 61CECh. 12 - Prob. 62CECh. 12 - Prob. 63CECh. 12 - Prob. 64CECh. 12 - Prob. 65CECh. 12 - In the following regression, X = weekly pay, Y =...Ch. 12 - Prob. 67CECh. 12 - In the following regression, X = total assets (...Ch. 12 - Prob. 69CECh. 12 - Below are percentages for annual sales growth and...Ch. 12 - Prob. 71CECh. 12 - Prob. 72CECh. 12 - Prob. 73CECh. 12 - Simple regression was employed to establish the...Ch. 12 - Prob. 75CECh. 12 - Prob. 76CECh. 12 - Prob. 77CECh. 12 - Below are revenue and profit (both in billions)...Ch. 12 - Below are fitted regressions based on used vehicle...Ch. 12 - Below are results of a regression of Y = average...Ch. 12 - Prob. 81CE
Knowledge Booster


Learn more about
Need a deep-dive on the concept behind this application? Look no further. Learn more about this topic, statistics and related others by exploring similar questions and additional content below.Similar questions
- The coefficient of correlation between X and Y is - and o? = a, o = 4a, and %3D %3D ož = 114 where Z = 3X – 4Y. Then the value of the constant a isarrow_forwardCalculate Pearson's correlation coefficient r. Then explain the direction and strength of the relationship based on the r.arrow_forwardData comprises of the number of hours studied (X) and the exam grade (Y) obtained for 6 first year students registered at UWC. The equation of best fit is given by: y = 67.071 + 4.535x. The correlation coefficient is found to be 0.557. What is the coefficient of determination?arrow_forward
- Match the value of the corelation to the data in the scatterplot. (a) (b) (c) Ar=-0.51 vScatterplot (a) vScatterplot (b) VScatterplot (c) vScatterplot (d) B.r= 0.89 C.r = 0.99 D.r= - 0.12arrow_forwardQI For the next data ,the correlation factor ( r) is: * X : x: 2 5 8 11 14 And y = 4 xarrow_forwardThe value of correlation coefficient between variables X and Y lies between:A. 1 and 2B. 0 and 1C. -1 and +1D. -1 and 0arrow_forward
- : 18 Calculate Coefficient of Correlation between x and y. 6. 4 y: 9. 13arrow_forwardd.Find the correlation coefficient between x and y. Show your calculations.e.Comment on the direction and the strength of the association between x and yf. Find the mean value of (x– y) and the standard deviation of (x – y). Show your calculations.arrow_forwardWhat does the z=? what is the p value?arrow_forward
- The equation for the line of best fit for some data comparing the height of a candle (H) with time (T) is H = -3.2T + 20, with R2 = 0.39. The correlation coefficient for these data is: -0.62 0.62 O 0.39 acerarrow_forward10 – 11. Margaret, an archeologist, is conducting a test to determine if there is a positive linear relationship between the total height of a dinosaur and its leg length. Her random sample of 15 dinosaur total heights (in feet) and leg lengths (in feet) produced the results shown in the following TI calculator screen. Use the TI calculations in the screen shot to help you answer questions: 10 & 11. LinReg y=a+bx a=28.67845743 b=5.639892354 r=559696513 r=.7481286741 10. What would you predict for a dinosaur's total height (to 2 decimal places) in feet, if the leg length is 5.8 feet? a) 61.39 feet b) 28.68 feet c) 114.99 feet d) 61.33 feet e) 74.81 feet 11. What percent of variation in the dinosaur's total height can be accounted for by the variation in the dinosaur's leg length? a) 28.68% b) 5.64%% c) 55.97% d) 74.81% e) none of thesearrow_forwardThe coefficient of correlation between X and Y is and of = a, o = 4a, and a = 114 where Z=3X-4Y. Then the value of the constant a is 2.arrow_forward
arrow_back_ios
SEE MORE QUESTIONS
arrow_forward_ios
Recommended textbooks for you
 Glencoe Algebra 1, Student Edition, 9780079039897...AlgebraISBN:9780079039897Author:CarterPublisher:McGraw Hill
Glencoe Algebra 1, Student Edition, 9780079039897...
Algebra
ISBN:9780079039897
Author:Carter
Publisher:McGraw Hill
Correlation Vs Regression: Difference Between them with definition & Comparison Chart; Author: Key Differences;https://www.youtube.com/watch?v=Ou2QGSJVd0U;License: Standard YouTube License, CC-BY
Correlation and Regression: Concepts with Illustrative examples; Author: LEARN & APPLY : Lean and Six Sigma;https://www.youtube.com/watch?v=xTpHD5WLuoA;License: Standard YouTube License, CC-BY