
Concept explainers
Videos
Instructions: Choose one or more of the data sets A–J below, or as assigned by your instructor. The first column is the X, or independent, variable and the second column is the Y, or dependent, variable. Use Excel or a statistical package (e.g., MegaStat or Minitab) to obtain the simple regression and required graphs. Write your answers to exercises 12.46 through 12.61 (or those assigned by your instructor) in a concise report, labeling your answers to each question. Insert tables and graphs in your report as appropriate. You may work with a partner if your instructor allows it.
State your a priori hypothesis about the sign of the slope. Is it reasonable to suppose a cause-and-effect relationship?
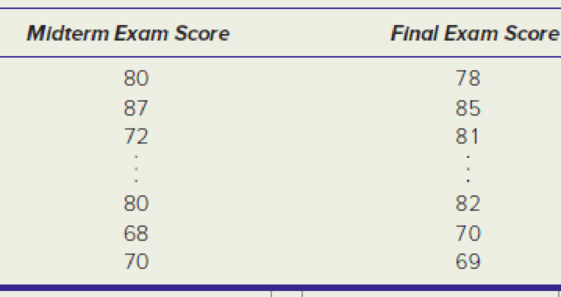
DATA SET B Midterm and Final Exam Scores for Business Statistics Students, Fall Semester 2011 (n = 58 students)
Want to see the full answer?
Check out a sample textbook solution
Chapter 12 Solutions
APPLIED STAT.IN BUS.+ECONOMICS


- Sales Barnes & Noble had annual sales of $6.8 billion in 2013 and $6.1 billion in 2015. Use the Midpoint Formula to estimate the sales in 2014. Assume that the annual sales followed a linear pattern.arrow_forwardFind the equation of the regression line for the following data set. x 1 2 3 y 0 3 4arrow_forwardWhat is interpolation when using a linear model?arrow_forward
 Calculus For The Life SciencesCalculusISBN:9780321964038Author:GREENWELL, Raymond N., RITCHEY, Nathan P., Lial, Margaret L.Publisher:Pearson Addison Wesley,
 Glencoe Algebra 1, Student Edition, 9780079039897...AlgebraISBN:9780079039897Author:CarterPublisher:McGraw Hill
 Algebra & Trigonometry with Analytic GeometryAlgebraISBN:9781133382119Author:SwokowskiPublisher:Cengage
 Trigonometry (MindTap Course List)TrigonometryISBN:9781337278461Author:Ron LarsonPublisher:Cengage Learning
 Big Ideas Math A Bridge To Success Algebra 1: Stu...AlgebraISBN:9781680331141Author:HOUGHTON MIFFLIN HARCOURTPublisher:Houghton Mifflin Harcourt