
APPLIED STAT.IN BUS.+ECONOMICS
6th Edition
ISBN: 9781259957598
Author: DOANE
Publisher: RENT MCG
expand_more
expand_more
format_list_bulleted
Concept explainers
Videos
Textbook Question
Chapter 12.5, Problem 26SE
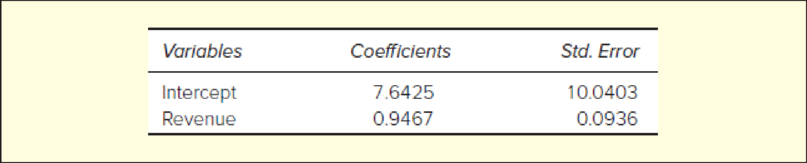
A regression was performed using data on 16 randomly selected charities. The variables were Y = expenses (millions of dollars) and X = revenue (millions of dollars). (a) Write the fitted regression equation. (b) Construct a 95 percent confidence interval for the slope. (c) Perform a right-tailed t test for zero slope at α = .05. State the hypotheses clearly. (d) Use Excel to find the p-value for the t statistic for the slope.
Expert Solution & Answer
Want to see the full answer?
Check out a sample textbook solution
Students have asked these similar questions
1 for all k, and set o
(ii) Let X1, X2,
that P(Xkb) =
x > 0.
Xn be independent random variables with mean 0, suppose
=
and
Var Xk. Then, for
0x) ≤2 exp-tx+121
Στ
k=1
Lemma 1.1 Suppose that g is a non-negative, non-decreasing function such that
E g(X) 0. Then,
E g(|X|)
P(|X|> x) ≤
g(x)
Proof of this Theorem
Theorem 1.2 (i) Suppose that P(|X| ≤ b) = 1 for some b > 0, that E X = 0, and
set Var X = o². Then, for 0 0,
P(X > x) ≤ e−1x+1²²,
P(|X|> x) ≤ 2e−x+1² 0²
Chapter 12 Solutions
APPLIED STAT.IN BUS.+ECONOMICS
Ch. 12.1 - For each sample, do a test for zero correlation....Ch. 12.1 - Instructions for Exercises 12.2 and 12.3: (a) Make...Ch. 12.1 - Prob. 3SECh. 12.1 - Prob. 4SECh. 12.1 - Instructions for exercises 12.412.6: (a) Make a...Ch. 12.1 - Prob. 6SECh. 12.2 - (a) Interpret the slope of the fitted regression...Ch. 12.2 - (a) Interpret the slope of the fitted regression...Ch. 12.2 - Prob. 9SECh. 12.2 - (a) Interpret the slope of the fitted regression...
Ch. 12.2 - (a) Interpret the slope of the fitted regression...Ch. 12.3 - Prob. 12SECh. 12.3 - Prob. 13SECh. 12.3 - The regression equation Credits = 15.4 .07 Work...Ch. 12.3 - Below are fitted regressions for Y = asking price...Ch. 12.3 - Refer back to the regression equation in exercise...Ch. 12.3 - Refer back to the regression equation in exercise...Ch. 12.4 - Instructions for exercises 12.18 and 12.19: (a)...Ch. 12.4 - Instructions for exercises 12.18 and 12.19: (a)...Ch. 12.4 - Instructions for exercises 12.2012.22: (a) Use...Ch. 12.4 - Instructions for exercises 12.2012.22: (a) Use...Ch. 12.4 - Instructions for exercises 12.2012.22: (a) Use...Ch. 12.5 - Instructions for exercises 12.23 and 12.24: (a)...Ch. 12.5 - Instructions for exercises 12.23 and 12.24: (a)...Ch. 12.5 - A regression was performed using data on 32 NFL...Ch. 12.5 - A regression was performed using data on 16...Ch. 12.6 - Below is a regression using X = home price (000),...Ch. 12.6 - Below is a regression using X = average price, Y =...Ch. 12.6 - Instructions for exercises 12.2912.31: (a) Use...Ch. 12.6 - Instructions for exercises 12.2912.31: (a) Use...Ch. 12.6 - Instructions for exercises 12.2912.31: (a) Use...Ch. 12.7 - Refer to the Weekly Earnings data set below. (a)...Ch. 12.7 - Prob. 33SECh. 12.8 - Prob. 34SECh. 12.8 - Prob. 35SECh. 12.9 - Calculate the standardized residual ei and...Ch. 12.9 - Prob. 37SECh. 12.9 - An estimated regression for a random sample of...Ch. 12.9 - An estimated regression for a random sample of...Ch. 12.9 - Prob. 40SECh. 12.9 - Prob. 41SECh. 12.9 - Prob. 42SECh. 12.9 - Prob. 43SECh. 12.11 - Prob. 44SECh. 12.11 - Prob. 45SECh. 12 - (a) How does correlation analysis differ from...Ch. 12 - (a) What is a simple regression model? (b) State...Ch. 12 - (a) Explain how you fit a regression to an Excel...Ch. 12 - (a) Explain the logic of the ordinary least...Ch. 12 - (a) Why cant we use the sum of the residuals to...Ch. 12 - Prob. 6CRCh. 12 - Prob. 7CRCh. 12 - Prob. 8CRCh. 12 - Prob. 9CRCh. 12 - Prob. 10CRCh. 12 - Prob. 11CRCh. 12 - Prob. 12CRCh. 12 - (a) What is heteroscedasticity? Identify its two...Ch. 12 - (a) What is autocorrelation? Identify two main...Ch. 12 - Prob. 15CRCh. 12 - Prob. 16CRCh. 12 - (a) What is a log transform? (b) What are its...Ch. 12 - (a) When is logistic regression needed? (b) Why...Ch. 12 - Prob. 46CECh. 12 - Prob. 47CECh. 12 - Prob. 48CECh. 12 - Instructions: Choose one or more of the data sets...Ch. 12 - Prob. 50CECh. 12 - Prob. 51CECh. 12 - Prob. 52CECh. 12 - Prob. 53CECh. 12 - Instructions: Choose one or more of the data sets...Ch. 12 - Instructions: Choose one or more of the data sets...Ch. 12 - Instructions: Choose one or more of the data sets...Ch. 12 - Prob. 57CECh. 12 - Prob. 58CECh. 12 - Prob. 59CECh. 12 - Prob. 60CECh. 12 - Prob. 61CECh. 12 - Prob. 62CECh. 12 - Prob. 63CECh. 12 - Prob. 64CECh. 12 - Prob. 65CECh. 12 - In the following regression, X = weekly pay, Y =...Ch. 12 - Prob. 67CECh. 12 - In the following regression, X = total assets (...Ch. 12 - Prob. 69CECh. 12 - Below are percentages for annual sales growth and...Ch. 12 - Prob. 71CECh. 12 - Prob. 72CECh. 12 - Prob. 73CECh. 12 - Simple regression was employed to establish the...Ch. 12 - Prob. 75CECh. 12 - Prob. 76CECh. 12 - Prob. 77CECh. 12 - Below are revenue and profit (both in billions)...Ch. 12 - Below are fitted regressions based on used vehicle...Ch. 12 - Below are results of a regression of Y = average...Ch. 12 - Prob. 81CE
Knowledge Booster


Learn more about
Need a deep-dive on the concept behind this application? Look no further. Learn more about this topic, statistics and related others by exploring similar questions and additional content below.Similar questions
- State and prove the Morton's inequality Theorem 1.1 (Markov's inequality) Suppose that E|X|" 0, and let x > 0. Then, E|X|" P(|X|> x) ≤ x"arrow_forward(iii) If, in addition, X1, X2, ... Xn are identically distributed, then P(S|>x) ≤2 exp{-tx+nt²o}}.arrow_forward5. State space models Consider the model T₁ = Tt−1 + €t S₁ = 0.8S-4+ Nt Y₁ = T₁ + S₁ + V₂ where (+) Y₁,..., Y. ~ WN(0,σ²), nt ~ WN(0,σ2), and (V) ~ WN(0,0). We observe data a. Write the model in the standard (matrix) form of a linear Gaussian state space model. b. Does lim+++∞ Var (St - St|n) exist? If so, what is its value? c. Does lim∞ Var(T₁ — Ît\n) exist? If so, what is its value?arrow_forward
- Let X represent the full height of a certain species of tree. Assume that X has a normal probability distribution with mean 203.8 ft and standard deviation 43.8 ft. You intend to measure a random sample of n = 211trees. The bell curve below represents the distribution of these sample means. The scale on the horizontal axis (each tick mark) is one standard error of the sampling distribution. Complete the indicated boxes, correct to two decimal places. Image attached. I filled in the yellow boxes and am not sure why they are wrong. There are 3 yellow boxes filled in with values 206.82; 209.84; 212.86.arrow_forwardCould you please answer this question using excel.Thanksarrow_forwardQuestions An insurance company's cumulative incurred claims for the last 5 accident years are given in the following table: Development Year Accident Year 0 2018 1 2 3 4 245 267 274 289 292 2019 255 276 288 294 2020 265 283 292 2021 263 278 2022 271 It can be assumed that claims are fully run off after 4 years. The premiums received for each year are: Accident Year Premium 2018 306 2019 312 2020 318 2021 326 2022 330 You do not need to make any allowance for inflation. 1. (a) Calculate the reserve at the end of 2022 using the basic chain ladder method. (b) Calculate the reserve at the end of 2022 using the Bornhuetter-Ferguson method. 2. Comment on the differences in the reserves produced by the methods in Part 1.arrow_forward
- Calculate the correlation coefficient r, letting Row 1 represent the x-values and Row 2 the y-values. Then calculate it again, letting Row 2 represent the x-values and Row 1 the y-values. What effect does switching the variables have on r? Row 1 Row 2 13 149 25 36 41 60 62 78 S 205 122 195 173 133 197 24 Calculate the correlation coefficient r, letting Row 1 represent the x-values and Row 2 the y-values. r=0.164 (Round to three decimal places as needed.) S 24arrow_forwardThe number of initial public offerings of stock issued in a 10-year period and the total proceeds of these offerings (in millions) are shown in the table. The equation of the regression line is y = 47.109x+18,628.54. Complete parts a and b. 455 679 499 496 378 68 157 58 200 17,942|29,215 43,338 30,221 67,266 67,461 22,066 11,190 30,707| 27,569 Issues, x Proceeds, 421 y (a) Find the coefficient of determination and interpret the result. (Round to three decimal places as needed.)arrow_forwardQuestions An insurance company's cumulative incurred claims for the last 5 accident years are given in the following table: Development Year Accident Year 0 2018 1 2 3 4 245 267 274 289 292 2019 255 276 288 294 2020 265 283 292 2021 263 278 2022 271 It can be assumed that claims are fully run off after 4 years. The premiums received for each year are: Accident Year Premium 2018 306 2019 312 2020 318 2021 326 2022 330 You do not need to make any allowance for inflation. 1. (a) Calculate the reserve at the end of 2022 using the basic chain ladder method. (b) Calculate the reserve at the end of 2022 using the Bornhuetter-Ferguson method. 2. Comment on the differences in the reserves produced by the methods in Part 1.arrow_forward
- Use the accompanying Grade Point Averages data to find 80%,85%, and 99%confidence intervals for the mean GPA. view the Grade Point Averages data. Gender College GPAFemale Arts and Sciences 3.21Male Engineering 3.87Female Health Science 3.85Male Engineering 3.20Female Nursing 3.40Male Engineering 3.01Female Nursing 3.48Female Nursing 3.26Female Arts and Sciences 3.50Male Engineering 3.00Female Arts and Sciences 3.13Female Nursing 3.34Female Nursing 3.67Female Education 3.45Female Engineering 3.17Female Health Science 3.28Female Nursing 3.25Male Engineering 3.72Female Arts and Sciences 2.68Female Nursing 3.40Female Health Science 3.76Female Arts and Sciences 3.72Female Education 3.44Female Arts and Sciences 3.61Female Education 3.29Female Nursing 3.20Female Education 3.80Female Business 3.26Male…arrow_forwardBusiness Discussarrow_forwardCould you please answer this question using excel. For 1a) I got 84.75 and for part 1b) I got 85.33 and was wondering if you could check if my answers were correct. Thanksarrow_forward
arrow_back_ios
SEE MORE QUESTIONS
arrow_forward_ios
Recommended textbooks for you
 Glencoe Algebra 1, Student Edition, 9780079039897...AlgebraISBN:9780079039897Author:CarterPublisher:McGraw Hill
 Big Ideas Math A Bridge To Success Algebra 1: Stu...AlgebraISBN:9781680331141Author:HOUGHTON MIFFLIN HARCOURTPublisher:Houghton Mifflin Harcourt
 Functions and Change: A Modeling Approach to Coll...AlgebraISBN:9781337111348Author:Bruce Crauder, Benny Evans, Alan NoellPublisher:Cengage Learning
Glencoe Algebra 1, Student Edition, 9780079039897...
Algebra
ISBN:9780079039897
Author:Carter
Publisher:McGraw Hill
Big Ideas Math A Bridge To Success Algebra 1: Stu...
Algebra
ISBN:9781680331141
Author:HOUGHTON MIFFLIN HARCOURT
Publisher:Houghton Mifflin Harcourt
Functions and Change: A Modeling Approach to Coll...
Algebra
ISBN:9781337111348
Author:Bruce Crauder, Benny Evans, Alan Noell
Publisher:Cengage Learning
Correlation Vs Regression: Difference Between them with definition & Comparison Chart; Author: Key Differences;https://www.youtube.com/watch?v=Ou2QGSJVd0U;License: Standard YouTube License, CC-BY
Correlation and Regression: Concepts with Illustrative examples; Author: LEARN & APPLY : Lean and Six Sigma;https://www.youtube.com/watch?v=xTpHD5WLuoA;License: Standard YouTube License, CC-BY