
Concept explainers
Videos
The authors of the paper “Racial Stereotypes in Children’s Television Commercials” (Journal of Advertising Research [2008]: 80–93) counted the number of times that characters of different ethnicities appeared in commercials aired on Philadelphia television stations, resulting in the data in the accompanying table.
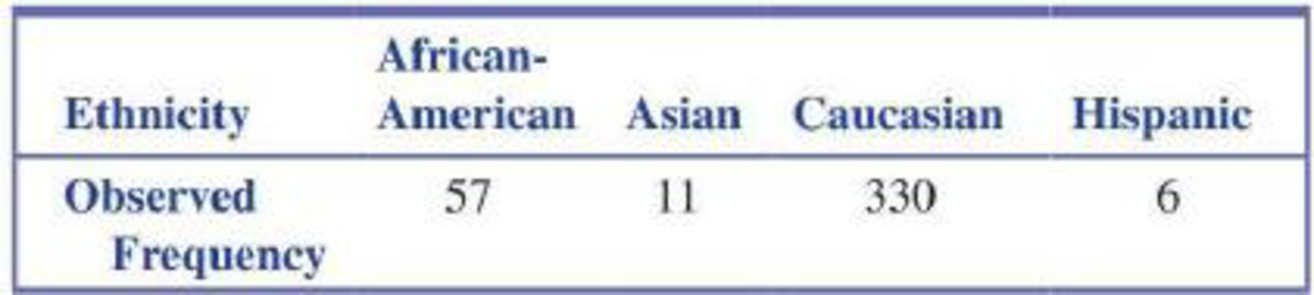
Based on the 2000 Census, the proportion of the U.S. population falling into each of these four ethnic groups are 0.177 for African-American, 0.032 for Asian, 0.734 for Caucasian, and 0.057 for Hispanic. Do the data provide sufficient evidence to conclude that the proportions appearing in commercials are not the same as the census proportions? Test the relevant hypotheses using a significance level of 0.01. (Hint: See Example 12.2.)

Trending nowThis is a popular solution!

Chapter 12 Solutions
Introduction To Statistics And Data Analysis


 Glencoe Algebra 1, Student Edition, 9780079039897...AlgebraISBN:9780079039897Author:CarterPublisher:McGraw Hill
 Holt Mcdougal Larson Pre-algebra: Student Edition...AlgebraISBN:9780547587776Author:HOLT MCDOUGALPublisher:HOLT MCDOUGAL