
Videos
In 2014, the University of Houston carried out a study for the Texas Lottery Commission (“Demographic Survey of Texas Lottery Players”) that gives the age distribution for a representative sample of 375 Texas Lottery players.
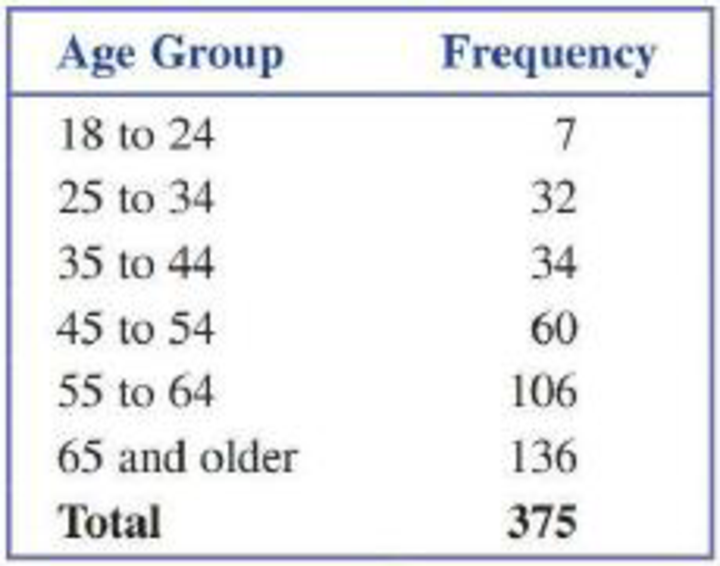
Using data from the U.S. Census Bureau (census.gov) for 2014, the age distribution of adults in Texas was 14% between age 18 and 24, 20% between age 25 and 34, 19% between age 35 and 44, 18% between age 45 and 54, 14% between age 55 and 64, and 15% age 65 or older. Is it reasonable to conclude that one or more of the age groups buys a disproportionate share of Texas Lottery tickets? Use a chi-square goodness-of-fit test with α = 0.05.
(Hint: See Example 12.2.)

Trending nowThis is a popular solution!

Chapter 12 Solutions
Introduction To Statistics And Data Analysis


 Holt Mcdougal Larson Pre-algebra: Student Edition...AlgebraISBN:9780547587776Author:HOLT MCDOUGALPublisher:HOLT MCDOUGAL
 Glencoe Algebra 1, Student Edition, 9780079039897...AlgebraISBN:9780079039897Author:CarterPublisher:McGraw Hill
 College Algebra (MindTap Course List)AlgebraISBN:9781305652231Author:R. David Gustafson, Jeff HughesPublisher:Cengage Learning
 Big Ideas Math A Bridge To Success Algebra 1: Stu...AlgebraISBN:9781680331141Author:HOUGHTON MIFFLIN HARCOURTPublisher:Houghton Mifflin Harcourt