
Concept explainers
Videos
(a)
To construct: the residual figure.
(a)
Explanation of Solution
Given:

Graph:
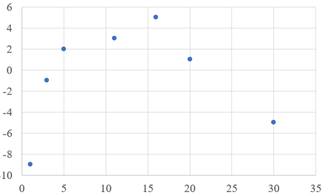
The residual is negative if the point is under the blue regression line. If the point is above the blue regression line, the value is positive. The exact value of the residual is the vertical distance to the blue line. The residual plot is having time values on the horizontal axis and the rest are on the vertical axis. There is then above a probable residual plot.
(b)
To Explain: the reason that a linear model is not suitable for explaining the association between percent of words recalled and practise time.
(b)
Answer to Problem 6CRE
Not appropriate
Explanation of Solution
Given:
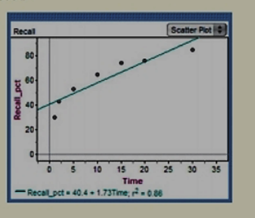
By seeing the plot, it is observed that A linear model is not suitable, because the
(c)
To find: that would a power model or an exponential model explain the relationship better, Explain the answer.
(c)
Answer to Problem 6CRE
Power Model
Explanation of Solution
Given:
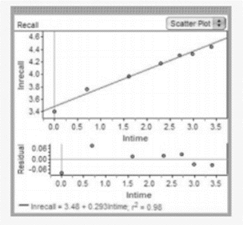
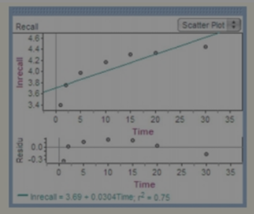
The top scatterplot plot is a power model (both of these variables are in), where the bottom scatterplot plot refers to an exponential model. The model which best explains the relation has by far the most linear pattern in the scatterplot.
(d)
To find: word recall estimation for 25 seconds of Part (c) practise.
(d)
Answer to Problem 6CRE
Word recalled
Explanation of Solution
Given:
Calculation:
Regression equation for the top scatterplot:
Where the
Putting the value of
Taking the exponential
Chapter 12 Solutions
The Practice of Statistics for AP - 4th Edition
Additional Math Textbook Solutions
Elementary Statistics
An Introduction to Mathematical Statistics and Its Applications (6th Edition)
Basic Business Statistics, Student Value Edition (13th Edition)
Elementary Statistics (13th Edition)
Introductory Statistics (2nd Edition)


 MATLAB: An Introduction with ApplicationsStatisticsISBN:9781119256830Author:Amos GilatPublisher:John Wiley & Sons Inc
 Probability and Statistics for Engineering and th...StatisticsISBN:9781305251809Author:Jay L. DevorePublisher:Cengage Learning
 Statistics for The Behavioral Sciences (MindTap C...StatisticsISBN:9781305504912Author:Frederick J Gravetter, Larry B. WallnauPublisher:Cengage Learning
 Elementary Statistics: Picturing the World (7th E...StatisticsISBN:9780134683416Author:Ron Larson, Betsy FarberPublisher:PEARSON
 The Basic Practice of StatisticsStatisticsISBN:9781319042578Author:David S. Moore, William I. Notz, Michael A. FlignerPublisher:W. H. Freeman
 Introduction to the Practice of StatisticsStatisticsISBN:9781319013387Author:David S. Moore, George P. McCabe, Bruce A. CraigPublisher:W. H. Freeman