
Concept explainers
Videos
a)
To explain the relationship using
a)
Answer to Problem 45PT4
The relationship between two variables is strong curvature.
Explanation of Solution
Given:
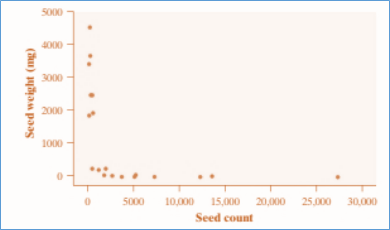
The relationship between two variables is strong curvature. Therefore, it is not linear relationship. Also, there appears to be one outlier at rightmost point.
b)
To identify which model predicts better.
b)
Answer to Problem 45PT4
Model B.
Explanation of Solution
Given:
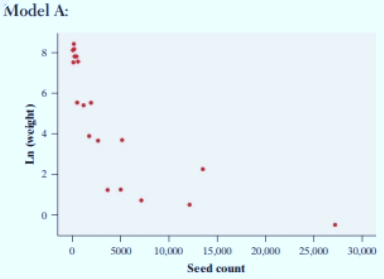
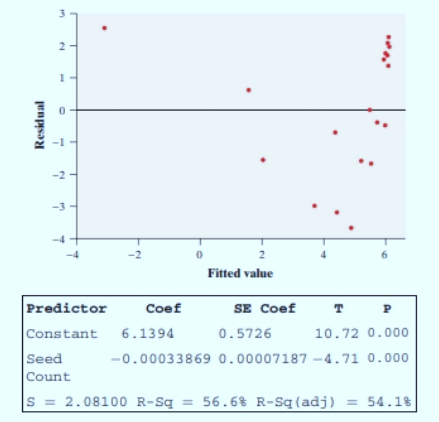
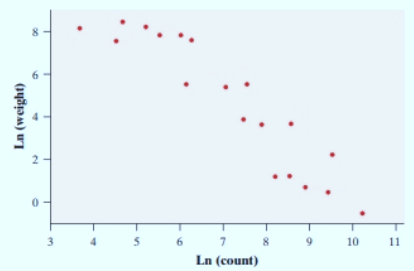

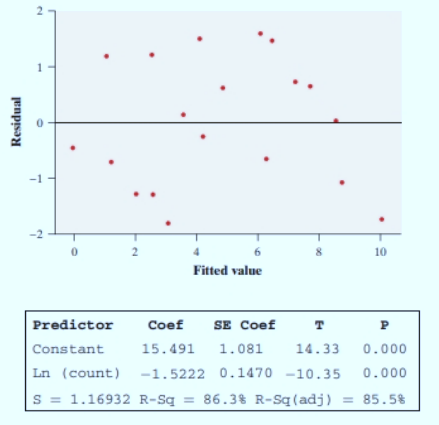
The scatter plot and residual plot of Model A shows strong curvature as compare to Model B. Also, the residuals in the residual plot of Model B shows randomly scattered. Hence, Model B gives better prediction.
c)
To predict the seed weight if the seed count is 3700 using model B.
c)
Answer to Problem 45PT4
The predicted seed weight is 19.7766 mg.
Explanation of Solution
Given:
Formula:
The general linear regression equation,
From given model,
Therefore, the model is,
Put count = 3700
Hence, the predicted seed weight is 19.7766 mg.
d)
To interpret the value of r2.
d)
Answer to Problem 45PT4
The 86.3% of the variation in ln(weight) is explained by the linear model.
Explanation of Solution
Given:

The R-square is the percentage of variation in dependent variable explained by the model.
The R-square = 86.3%. Therefore, the 86.3% of the variation in ln(weight) is explained by the linear model.
Chapter 12 Solutions
The Practice of Statistics for AP - 4th Edition
Additional Math Textbook Solutions
Introductory Statistics (2nd Edition)
Essentials of Statistics (6th Edition)
Elementary Statistics (13th Edition)
Introductory Statistics (10th Edition)
An Introduction to Mathematical Statistics and Its Applications (6th Edition)
Statistical Reasoning for Everyday Life (5th Edition)


 MATLAB: An Introduction with ApplicationsStatisticsISBN:9781119256830Author:Amos GilatPublisher:John Wiley & Sons Inc
 Probability and Statistics for Engineering and th...StatisticsISBN:9781305251809Author:Jay L. DevorePublisher:Cengage Learning
 Statistics for The Behavioral Sciences (MindTap C...StatisticsISBN:9781305504912Author:Frederick J Gravetter, Larry B. WallnauPublisher:Cengage Learning
 Elementary Statistics: Picturing the World (7th E...StatisticsISBN:9780134683416Author:Ron Larson, Betsy FarberPublisher:PEARSON
 The Basic Practice of StatisticsStatisticsISBN:9781319042578Author:David S. Moore, William I. Notz, Michael A. FlignerPublisher:W. H. Freeman
 Introduction to the Practice of StatisticsStatisticsISBN:9781319013387Author:David S. Moore, George P. McCabe, Bruce A. CraigPublisher:W. H. Freeman