
Elementary Statistics: A Step By Step Approach
10th Edition
ISBN: 9781259755330
Author: Allan G. Bluman
Publisher: McGraw-Hill Education
expand_more
expand_more
format_list_bulleted
Concept explainers
Videos
Textbook Question
Chapter 10.3, Problem 17E
Compute the standard error of the estimate for Exercise 15 in Section 10–1. The regression line equation was found in Exercise 15 in Section 10–2.
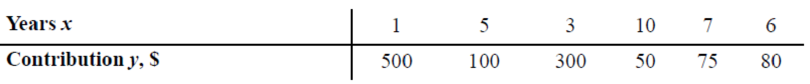
15. Alumni Contributions Years and contribution data are as follows:
Expert Solution & Answer
Want to see the full answer?
Check out a sample textbook solution
Students have asked these similar questions
Using the data in Table 6–11, calculate a 3-month moving average forecastfor month 12.
Using the data in Table 6–11, calculate a 3-month moving average forecast for month 12.
Question 3. a) A Biologist is comparing intervals (m
seconds) between the matting calls of a certain species of
tree frog and the surrounding temperature (t degree
Celsius). The following results were obtained:
t 8 13 14 15
15
20
25
30
6.5
4.5
4
3
2
1
1. Fit the regression line in the form m = a + bt.
2. Interpret your estimates.
3. Use your regression line
interval between matting calls when the surrounding
temperature is 10 degrees. (6 marks)
estimate the time
Chapter 10 Solutions
Elementary Statistics: A Step By Step Approach
Ch. 10.1 - Stopping Distances In a study on speed control, it...Ch. 10.1 - What is meant by the statement that two variables...Ch. 10.1 - How is a linear relationship between two variables...Ch. 10.1 - What is the symbol for the sample correlation...Ch. 10.1 - What is the range of values for the correlation...Ch. 10.1 - What is meant when the relationship between the...Ch. 10.1 - Give examples of two variables that are positively...Ch. 10.1 - What is the diagram of the independent and...Ch. 10.1 - What is the name of the correlation coefficient...Ch. 10.1 - What statistical test is used to test the...
Ch. 10.1 - When two variables are correlated, can the...Ch. 10.1 - For Exercises 11 through 27, perform the following...Ch. 10.1 - For Exercises 11 through 27, perform the following...Ch. 10.1 - For Exercises 11 through 27, perform the following...Ch. 10.1 - For Exercises 11 through 27, perform the following...Ch. 10.1 - For Exercises 11 through 27, perform the following...Ch. 10.1 - For Exercises 11 through 27, perform the following...Ch. 10.1 - For Exercises 11 through 27, perform the following...Ch. 10.1 - For Exercises 11 through 27, perform the following...Ch. 10.1 - For Exercises 11 through 27, perform the following...Ch. 10.1 - For Exercises 11 through 27, perform the following...Ch. 10.1 - For Exercises 11 through 27, perform the following...Ch. 10.1 - For Exercises 11 through 27, perform the following...Ch. 10.1 - Prob. 23ECh. 10.1 - For Exercises 11 through 27, perform the following...Ch. 10.1 - For Exercises 11 through 27, perform the following...Ch. 10.1 - For Exercises 11 through 27, perform the following...Ch. 10.1 - Prob. 27ECh. 10.1 - Prob. 28ECCh. 10.1 - Prob. 29ECCh. 10.1 - Prob. 30ECCh. 10.2 - Applying the Concepts 102 Stopping Distances...Ch. 10.2 - What two things should be done before one performs...Ch. 10.2 - What are the assumptions for regression analysis?Ch. 10.2 - Prob. 3ECh. 10.2 - What is the symbol for the slope? For the y...Ch. 10.2 - Prob. 5ECh. 10.2 - When all the points fall on the regression line,...Ch. 10.2 - What is the relationship between the sign of the...Ch. 10.2 - As the value of the correlation coefficient...Ch. 10.2 - Prob. 9ECh. 10.2 - When the value of r is not significant, what value...Ch. 10.2 - For Exercises 11 through 27, use the same data as...Ch. 10.2 - Prob. 12ECh. 10.2 - For Exercises 11 through 27, use the same data as...Ch. 10.2 - For Exercises 11 through 27, use the same data as...Ch. 10.2 - For Exercises 11 through 27, use the same data as...Ch. 10.2 - For Exercises 11 through 27, use the same data as...Ch. 10.2 - Prob. 17ECh. 10.2 - For Exercises 11 through 27, use the same data as...Ch. 10.2 - For Exercises 11 through 27, use the same data as...Ch. 10.2 - For Exercises 11 through 27, use the same data as...Ch. 10.2 - For Exercises 11 through 27, use the same data as...Ch. 10.2 - For Exercises 11 through 27, use the same data as...Ch. 10.2 - For Exercises 11 through 27, use the same data as...Ch. 10.2 - For Exercises 11 through 27, use the same data as...Ch. 10.2 - Prob. 25ECh. 10.2 - Prob. 26ECh. 10.2 - For Exercises 11 through 27, use the same data as...Ch. 10.2 - For Exercises 28 through 33, do a complete...Ch. 10.2 - Prob. 29ECh. 10.2 - For Exercises 28 through 33, do a complete...Ch. 10.2 - For Exercises 28 through 33, do a complete...Ch. 10.2 - For Exercises 28 through 33, do a complete...Ch. 10.2 - Prob. 33ECh. 10.2 - For Exercises 34 and 35, do a complete regression...Ch. 10.2 - For Exercises 34 and 35, do a complete regression...Ch. 10.2 - For Exercises 13, 15, and 21 in Section 101, find...Ch. 10.2 - The y intercept value a can also be found by using...Ch. 10.2 - The value of the correlation coefficient can also...Ch. 10.3 - Applying the Concepts 103 Interpreting Simple...Ch. 10.3 - What is meant by the explained variation? How is...Ch. 10.3 - What is meant by the unexplained variation? How is...Ch. 10.3 - What is meant by the total variation? How is it...Ch. 10.3 - Define the coefficient of determination.Ch. 10.3 - How is the coefficient of determination found?Ch. 10.3 - Define the coefficient of nondetermination.Ch. 10.3 - How is the coefficient of nondetermination found?Ch. 10.3 - Prob. 8ECh. 10.3 - Prob. 9ECh. 10.3 - Prob. 10ECh. 10.3 - Prob. 11ECh. 10.3 - Prob. 12ECh. 10.3 - Prob. 13ECh. 10.3 - Prob. 14ECh. 10.3 - Prob. 15ECh. 10.3 - Compute the standard error of the estimate for...Ch. 10.3 - Compute the standard error of the estimate for...Ch. 10.3 - Compute the standard error of the estimate for...Ch. 10.3 - Prob. 19ECh. 10.3 - For the data in Exercises 14 in Sections 101 and...Ch. 10.3 - Prob. 21ECh. 10.3 - Prob. 22ECh. 10.4 - Applying the Concepts 104 More Math Means More...Ch. 10.4 - Explain the similarities and differences between...Ch. 10.4 - What is the general form of the multiple...Ch. 10.4 - Prob. 3ECh. 10.4 - Prob. 4ECh. 10.4 - How do the values of the individual correlation...Ch. 10.4 - Age, GPA, and Income A researcher has determined...Ch. 10.4 - Nursing Home Satisfaction A researcher found that...Ch. 10.4 - Special Occasion Cakes A pastry chef who...Ch. 10.4 - Aspects of Students Academic Behavior A college...Ch. 10.4 - Age, Cholesterol, and Sodium A medical researcher...Ch. 10.4 - Explain the meaning of the multiple correlation...Ch. 10.4 - What is the range of values R can assume?Ch. 10.4 - Prob. 13ECh. 10.4 - What are the hypotheses used to test the...Ch. 10.4 - What test is used to test the significance of R?Ch. 10.4 - What is the meaning of the adjusted R2? Why is it...Ch. 10 - For Exercises 1 through 7, do a complete...Ch. 10 - For Exercises 1 through 7, do a complete...Ch. 10 - For Exercises 1 through 7, do a complete...Ch. 10 - For Exercises 1 through 7, do a complete...Ch. 10 - For Exercises 1 through 7, do a complete...Ch. 10 - For Exercises 1 through 7, do a complete...Ch. 10 - For Exercises 1 through 7, do a complete...Ch. 10 - For Exercise 4, find the standard error of the...Ch. 10 - Prob. 10.3.9RECh. 10 - Prob. 10.3.10RECh. 10 - Prob. 10.3.11RECh. 10 - Prob. 10.3.12RECh. 10 - (Opt.) A study found a significant relationship...Ch. 10 - Prob. 10.4.14RECh. 10 - Prob. 10.4.15RECh. 10 - Prob. 1CQCh. 10 - Determine whether each statement is true or false....Ch. 10 - Determine whether each statement is true or false....Ch. 10 - Determine whether each statement is true or false....Ch. 10 - Determine whether each statement is true or false....Ch. 10 - Determine whether each statement is true or false....Ch. 10 - Prob. 7CQCh. 10 - Select the best answer. 8. To test the...Ch. 10 - Select the best answer. 9. The test of...Ch. 10 - Prob. 10CQCh. 10 - Prob. 11CQCh. 10 - Prob. 12CQCh. 10 - Complete the following statements with the best...Ch. 10 - Prob. 14CQCh. 10 - Prob. 15CQCh. 10 - Prob. 16CQCh. 10 - Prob. 17CQCh. 10 - Prob. 18CQCh. 10 - Prob. 19CQCh. 10 - Prob. 20CQCh. 10 - Prob. 21CQCh. 10 - Prob. 22CQCh. 10 - Prob. 23CQCh. 10 - For Exercise 20, find the 90% prediction interval...Ch. 10 - Prob. 25CQCh. 10 - Prob. 26CQCh. 10 - (Opt.) Find R when ryx1 = 0.561 and ryx2 = 0.714...Ch. 10 - Prob. 28CQCh. 10 - Prob. 1CTCCh. 10 - Prob. 2CTCCh. 10 - Prob. 3CTCCh. 10 - Prob. 4CTCCh. 10 - Product Sales When the points in a scatter plot...Ch. 10 - Prob. 6CTCCh. 10 - Prob. 7CTCCh. 10 - Product Sales When the points in a scatter plot...Ch. 10 - Prob. 9CTC
Knowledge Booster


Learn more about
Need a deep-dive on the concept behind this application? Look no further. Learn more about this topic, statistics and related others by exploring similar questions and additional content below.Similar questions
- The November 24, 2001, issue of The Economist published economic data for 15 industrialized nations. Included were the percent changes in gross domestic product (GDP), industrial production (IP), consumer prices (CP), and producer prices (PP) from Fall 2000 to Fall 2001, and the unemployment rate in Fall 2001 (UNEMP). An economist wants to construct a model to predict GDP from the other variables. A fit of the model GDP = , + P,IP + 0,UNEMP + f,CP + P,PP + € yields the following output: The regression equation is GDP = 1.19 + 0.17 IP + 0.18 UNEMP + 0.18 CP – 0.18 PP Predictor Coef SE Coef тР Constant 1.18957 0.42180 2.82 0.018 IP 0.17326 0.041962 4.13 0.002 UNEMP 0.17918 0.045895 3.90 0.003 CP 0.17591 0.11365 1.55 0.153 PP -0.18393 0.068808 -2.67 0.023 Predict the percent change in GDP for a country with IP = 0.5, UNEMP = 5.7, CP = 3.0, and PP = 4.1. a. b. If two countries differ in unemployment rate by 1%, by how much would you predict their percent changes in GDP to differ, other…arrow_forward1.2 number 12 reviewarrow_forwardOnly b.ii, iii and iv please. The output of a solar panel (photovoltaic) system depends on its size. A manufacturer states that the average daily production of its 1.5 kW system is 6.6 kilowatt hours (kWh) for Perth conditions. A consumer group monitored this 1.5 kW system in 20 different Perth homes and measured the average daily production by the systems in these homes over a one month period during October. The data is provided here. (a) Analyse the consumer group’s data to test if the manufacturer’s claim of an average of 6.6 kWh per day is reasonable. State appropriate hypotheses, assumptions and decision rule at α = 0.10. What conclusions would you report to the consumer group? Hint: You will need to find Descriptive Statistics first.) (b) If 48 homes in the central Australian city of Alice Springs had this system installed and similar data wascollected, in order to assess whether average daily production in Alice Springs exceeded 6.6 kWh, (i) what would the alternate hypothesis…arrow_forward
- Year and contribution data are as follows: Contribution y Years x 500 1 100 300 10 50 75 9. 80 Predict the contribution if x =4 years. O y = $251.42 when x = 4 years. O y = $402.74 when x = 4 years. Oy = $453.18 when x 4 years. O y = -$50.44 when x= 4 years. QUESTION 5 MacB 80 F1 F2 F3 F4 F5 1 2 4 6. < cO # 3arrow_forwarda.State the predictors available in this model.arrow_forwardIn 1999, the average percentage of women who received prenatal care per country is 80.1%. Table #7.3.9 contains the percentage of woman receiving prenatal care in 2009 for a sample of countries ("Pregnant woman receiving," 2013). Do the data show that the average percentage of women receiving prenatal care in 2009 is higher than in 1999? Test at the 5% level. Table #7.3.9: Percentage of Woman Receiving Prenatal Care 100.0 72.73 74.52 75.79 76.28 76.28 100.0 76.65 80.34 80.60 81.90 86.30 87.70 100.0 87.76 88.40 90.70 91.50 91.80 92.10 100.0 92.20 92.41 92.47 93.00 93.20 93.40 100.0 93.63 93.68 93.80 94.30 94.51 95.00 95.80 95.80 96.23 96.24 97.30 97.90 97.95 98.20 99.00 99.00 99.10 99.10arrow_forward
- The data file, data2.xls (Excel format), has been uploaded to this module. Click, download, and open this file. It contains: Table 1. Violent victimization, by type of crime, 2016, and 2017 Appendix table 3. Standard errors for table 1: Violent victimization, by type of crime, 2016, and 2017 From the estimation of the number of Rape/sexual assault (298,410) in 2016 at 95% CI. what is the lower limit?arrow_forwardExample 16.6 Refer to Example 16.3 where r = 0.84 and n = 6. Determine whether there is significant association between advertising expenditure and sales revenue.arrow_forwardEnvironmental conditions can affect the growth of coral. To study this, a researcher examined a species of coral that is found in the Caribbean Sea and the Gulf of Mexico. At 12 localities, he determined the average annual calcification rate of coral over a period of several years and the average annual maximum sea surface temperature during the same period. Calcification rate affects the growth of coral, with higher rates corresponding to greater growth. The table contains data for these 12 localities. Maximum sea surface temperature (°C) and calcification rate (g cm² yr¯¹) Maximum Sea Surface Temperature 29.4 29.4 29.4 29.6 29.1 28.7 Calcification Rate 1.48 1.53 1.52 1.48 1.31 1.25 Maximum Sea Surface Temperature 29.7 29.5 29.4 29.0 29.0 29.0 Calcification Rate 1.63 1.53 1.46 1.24 1.29 1.12 To access the complete data set, click the link for your preferred software format: Excel Minitab JMP SPSS TI R Mac-TXT PC-TXT CSV CrunchIt! The residuals for average annual maximum sea surface…arrow_forward
- The following table gives the millions of metric tons of carbon dioxide emissions in a certain country for selected years from 2010 and projected to 2032. Year 2010 2012 2014 2016 2018 2020 CO2 Emissions 339.5 361.5 399.1 425.8 452.1 495.4 Year 2022 2024 2026 2028 2030 2032 CO2 Emissions 556.2 595.9 629.7 665.1 703.1 743.7 (a) Create a linear function that models these data, with x as the number of years past 2010 and y as the millions of metric tons of carbon dioxide emissions. (Round all numerical values to two decimal places.) y(x) = X (b) Find the model's estimate for the 2022 data point. (Round your answer to two decimal places.) x million metric tons (c) Find the slope of the linear model. (Round your answer to two decimal places.) x Interpret the slope of the linear model. For each year since 2010 ✔ , carbon dioxide emissions in the U.S. are expected to change by x million metric tons.arrow_forwardThe table shows the total personal income in a country (in billions of dollars) for selected years from 1960 and projected to 2024. Complete parts (a) and (b) below. …. Year 1960 1970 1980 y=(x²+x+ (Type integers or decimals rounded to three decimal places as needed.) 1990 2000 Income ($ billions) Year 411.7 2008 838.6 2014 2307.9 2018 4878.7 2024 22685.5 8429.9 Income ($ billions) 12100.8 14728.6 19129.7 a. These data can be modeled by a quadratic function. Write the equation of this function, with x equal to the number of years after 1960. b. In what year does the model predict the total personal income will reach $24.772 trillion? The unrounded model predicts the total personal income will reach $24.772 trillion inarrow_forwardThe following table gives the millions of metric tons of carbon dioxide emissions in a certain country for selected years from 2010 and projected to 2032. Year 2010 2012 2014 2016 2018 2020 CO2 Emissions 337.5 361.5 395.1 425.8 451.1 496.4 Year 2022 2024 2026 2028 2030 2032 CO2 Emissions 558.2 592.9 628.7 662.1 709.1 742.7 (a) Create a linear function that models these data, with x as the number of years past 2010 and y as the millions of metric tons of carbon dioxide emissions. (Round all numerical values to two decimal places.)y(x) = (b) Find the model's estimate for the 2028 data point. (Round your answer to two decimal places.) million metric tons(c) Find the slope of the linear model. (Round your answer to two decimal places.)Interpret the slope of the linear model. For each year since ---Select--- 2009 2010 2015 2028 2032 , carbon dioxide emissions in the U.S. are expected to change by million metric tons.arrow_forward
arrow_back_ios
SEE MORE QUESTIONS
arrow_forward_ios
Recommended textbooks for you
 Calculus For The Life SciencesCalculusISBN:9780321964038Author:GREENWELL, Raymond N., RITCHEY, Nathan P., Lial, Margaret L.Publisher:Pearson Addison Wesley,
 Algebra & Trigonometry with Analytic GeometryAlgebraISBN:9781133382119Author:SwokowskiPublisher:Cengage
Calculus For The Life Sciences
Calculus
ISBN:9780321964038
Author:GREENWELL, Raymond N., RITCHEY, Nathan P., Lial, Margaret L.
Publisher:Pearson Addison Wesley,
Algebra & Trigonometry with Analytic Geometry
Algebra
ISBN:9781133382119
Author:Swokowski
Publisher:Cengage
Correlation Vs Regression: Difference Between them with definition & Comparison Chart; Author: Key Differences;https://www.youtube.com/watch?v=Ou2QGSJVd0U;License: Standard YouTube License, CC-BY
Correlation and Regression: Concepts with Illustrative examples; Author: LEARN & APPLY : Lean and Six Sigma;https://www.youtube.com/watch?v=xTpHD5WLuoA;License: Standard YouTube License, CC-BY