
Concept explainers
Videos
For Exercises 1 through 7, do a complete
a. Draw the
b. Compute the value of the
c. Test the significance of the correlation coefficient at α = 0.01, using Table I.
d. Determine the regression line equation if r is significant.
e. Plot the regression line on the scatter plot, if appropriate.
f. Predict y′ for a specific value of x, if appropriate.
Sections 10–1 and 10–2
2. Deaths from Lightning NOAA keeps track of not only deaths from lightning each year but also the circumstances under which those deaths occur. Listed below are the number of deaths from lightning other than when standing under a tree and the number that occurred when the victim was under a tree, for a random selection of years. Is there a linear relationship between the variables?
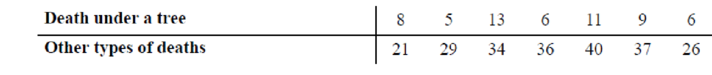
Find y′ when x = 10.
Want to see the full answer?
Check out a sample textbook solution
Chapter 10 Solutions
Elementary Statistics: A Step By Step Approach
Additional Math Textbook Solutions
APPLIED STAT.IN BUS.+ECONOMICS
Elementary Statistics: Picturing the World (6th Edition)
Elementary Statistics Using Excel (6th Edition)
STATS:DATA+MODELS-W/DVD
Business Statistics: A First Course (7th Edition)


- Find the equation of the regression line for the following data set. x 1 2 3 y 0 3 4arrow_forwardLife Expectancy The following table shows the average life expectancy, in years, of a child born in the given year42 Life expectancy 2005 77.6 2007 78.1 2009 78.5 2011 78.7 2013 78.8 a. Find the equation of the regression line, and explain the meaning of its slope. b. Plot the data points and the regression line. c. Explain in practical terms the meaning of the slope of the regression line. d. Based on the trend of the regression line, what do you predict as the life expectancy of a child born in 2019? e. Based on the trend of the regression line, what do you predict as the life expectancy of a child born in 1580?2300arrow_forwardFor the following exercises, consider the data in Table 5, which shows the percent of unemployed in a city ofpeople25 years or older who are college graduates is given below, by year. 41. Based on the set of data given in Table 7, calculatethe regression line using a calculator or othertechnology tool, and determine the correlationcoefficient to three decimal places.arrow_forward
 Functions and Change: A Modeling Approach to Coll...AlgebraISBN:9781337111348Author:Bruce Crauder, Benny Evans, Alan NoellPublisher:Cengage Learning
 Algebra & Trigonometry with Analytic GeometryAlgebraISBN:9781133382119Author:SwokowskiPublisher:Cengage
 Glencoe Algebra 1, Student Edition, 9780079039897...AlgebraISBN:9780079039897Author:CarterPublisher:McGraw Hill
 Calculus For The Life SciencesCalculusISBN:9780321964038Author:GREENWELL, Raymond N., RITCHEY, Nathan P., Lial, Margaret L.Publisher:Pearson Addison Wesley,