
Horngren's Cost Accounting: A Managerial Emphasis (16th Edition)
16th Edition
ISBN: 9780134475585
Author: Srikant M. Datar, Madhav V. Rajan
Publisher: PEARSON
expand_more
expand_more
format_list_bulleted
Concept explainers
Videos
Textbook Question
Chapter 10, Problem 10.23E
Various cost-behavior patterns. (CPA, adapted).
The vertical axes of the graphs below represent total cost, and the horizontal axes represent units produced during a calendar year. In each case, the zero point of dollars and production is at the intersection of the two axes.
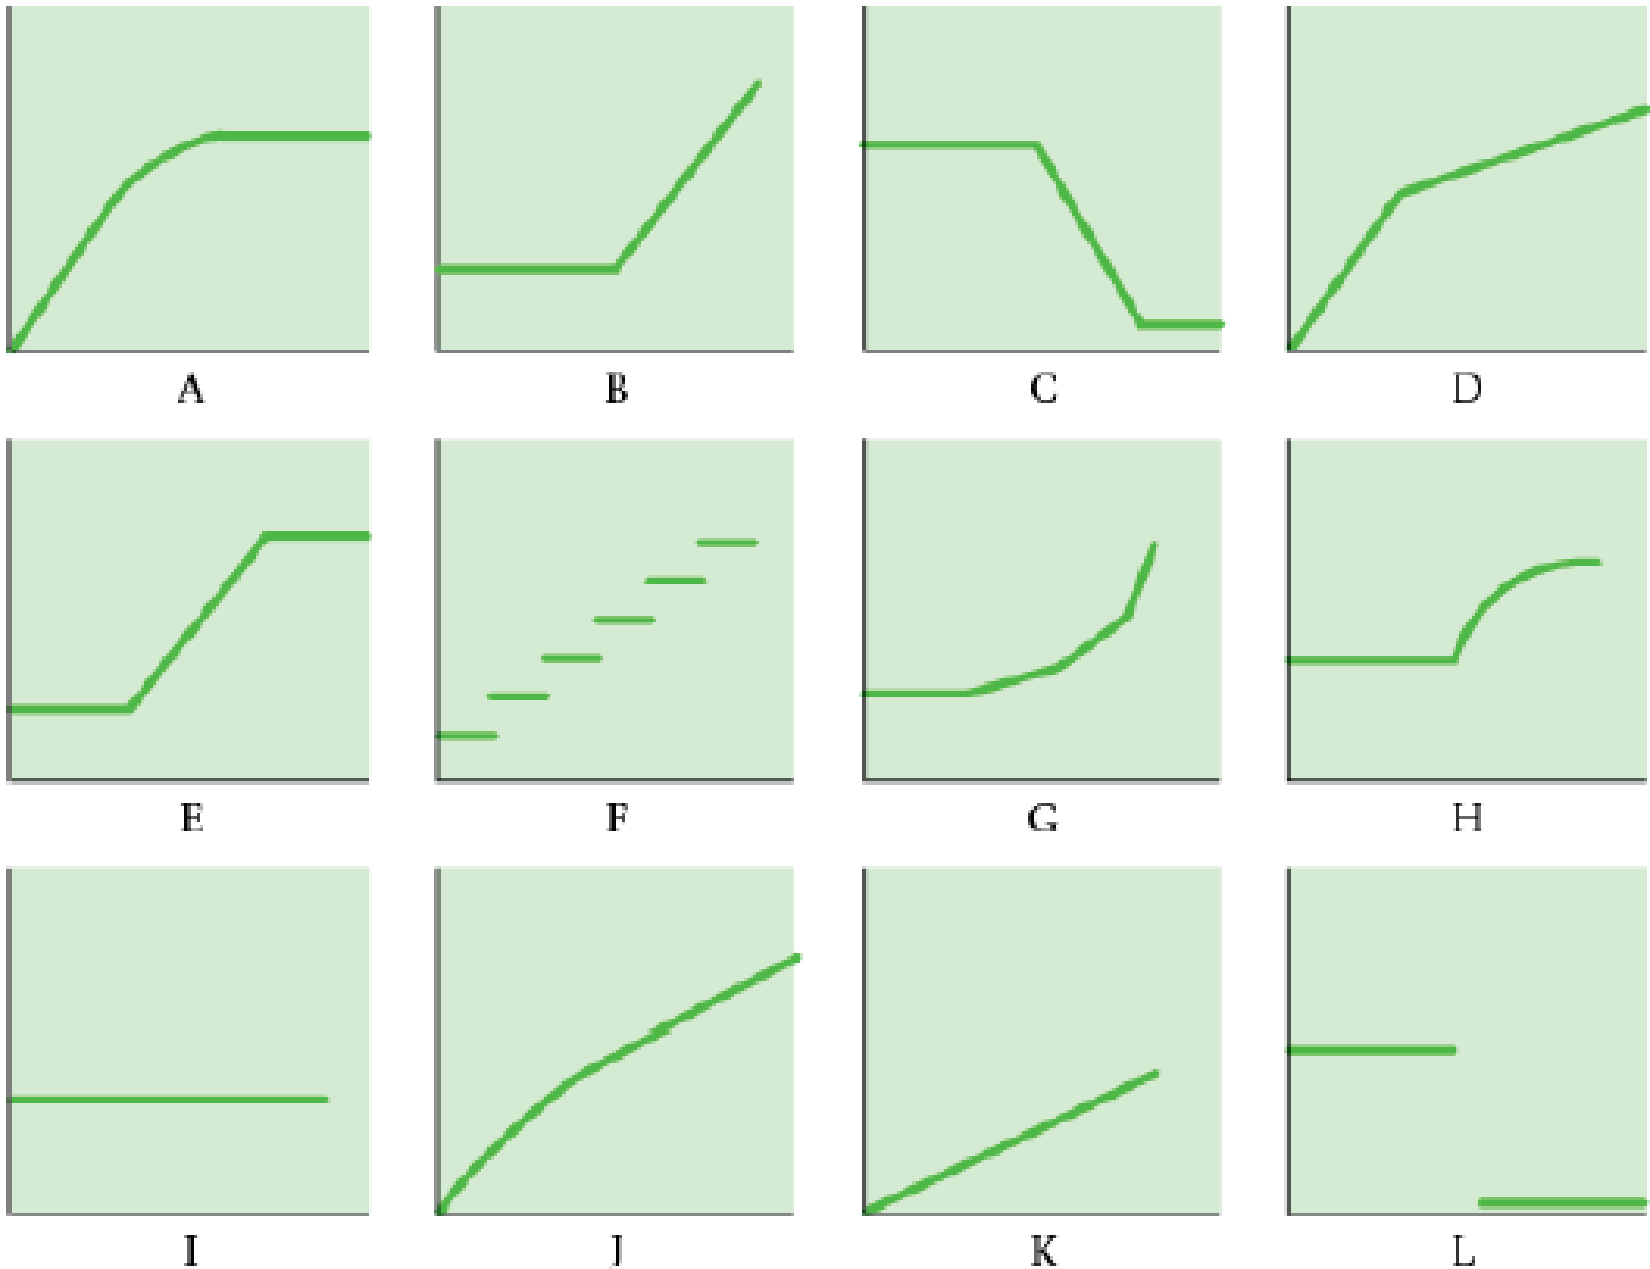
Select the graph that matches the numbered
Required
- 1. Annual depreciation of equipment where the amount of depreciation charged is computed by the machine-hours method.
- 2. Electricity bill—a flat fixed charge, plus a variable cost after a certain number of kilowatt-hours are used, in which the quantity of kilowatt-hours used varies proportionately with quantity of units produced.
- 3. City water bill, which is computed as follows:
| First 1,000,000 gallons or less | $1,000 flat fee |
| Next 10,000 gallons | $0.003 per gallon used |
| Next 10,000 gallons | $0.006 per gallon used |
| Next 10,000 gallons | $0.009 per gallon used |
| and so on | and so on |
The gallons of water used vary proportionately with the quantity of production output.
- 4. Cost of direct materials, where direct material cost per unit produced decreases with each pound of material used (for example, if 1 pound is used, the cost is $10; if 2 pounds are used, the cost is $19.98; if 3 pounds are used, the cost is $29.94), with a minimum cost per unit of $9.20.
- 5. Annual depreciation of equipment, where the amount is computed by the straight-line method. When the depreciation schedule was prepared, it was anticipated that the obsolescence factor would be greater than the wear-and-tear factor.
- 6. Rent on a manufacturing plant donated by the city, where the agreement calls for a fixed-fee payment unless 200,000 labor-hours are worked, in which case no rent is paid.
- 7. Salaries of repair personnel, where one person is needed for every 1,000 machine-hours or less (that is, 0 to 1,000 hours requires one person, 1,001 to 2,000 hours requires two people, and so on).
- 8. Cost of direct materials used (assume no quantity discounts).
- 9. Rent on a manufacturing plant donated by the county, where the agreement calls for rent of $100,000 to be reduced by $1 for each direct manufacturing labor-hour worked in excess of 200,000 hours, but a minimum rental fee of $20,000 must be paid.
Expert Solution & Answer
Want to see the full answer?
Check out a sample textbook solution
Students have asked these similar questions
Matching graphs with descriptions of cost and revenue behavior. (D. Green, adapted) Given here are a number of graphs. The horizontal axis of each graph represents the units produced over the year, and the vertical axis represents total cost or revenues.
Indicate by number which graph best fits the situation or item described (a–h). Some graphs may be used more than once; some may not apply to any of the situations.
Direct material costs
Supervisors’ salaries for one shift and two shifts
A cost-volume-profit graph
Mixed costs—for example, car rental fixed charge plus a rate per mile driven
Depreciation of plant, computed on a straight-line basis
Data supporting the use of a variable-cost rate, such as manufacturing labor cost of $14 per unit produced
Incentive bonus plan that pays managers $0.10 for every unit produced above some level of production
Interest expense on $2 million borrowed at a fixed rate of interest
Based on the attached image, compute the manufacturing cycle efficiency based on below data (to the nearest whole percentage)
Various cost-behavior patterns. (CPA, adapted).
The vertical axes of the graphs below represent total cost, and the horizontal axes represent units produced during a calendar year. In each case, the zero point of dollars and production is at the intersection of the two axes.
Select the graph that matches the numbered manufacturing cost data (requirements 1-9). Indicate by letter
which graph best fits the situation or item described. The graphs may be used more than once.
Annual depreciation of equipment, where the amount of depreciation charged is computed by the machine-hours method.
Electricity bill—a flat fixed charge, plus a variable cost after a certain number of kilowatt-hours are used, in which the quantity of kilowatt-hours used varies proportionately with quantity of units produced.
City water bill, which is computed as follows:
First 1,000,000 gallons or less $1,000 flat fee
Next 10,000 gallons $0.003 per gallon used
Next 10,000 gallons $0.006 per gallon used
Next 10,000…
Chapter 10 Solutions
Horngren's Cost Accounting: A Managerial Emphasis (16th Edition)
Ch. 10 - What two assumptions are frequently made when...Ch. 10 - Describe three alternative linear cost functions.Ch. 10 - What is the difference between a linear and a...Ch. 10 - High correlation between two variables means that...Ch. 10 - Name four approaches to estimating a cost...Ch. 10 - Describe the conference method for estimating a...Ch. 10 - Describe the account analysis method for...Ch. 10 - List the six steps in estimating a cost function...Ch. 10 - When using the high-low method, should you base...Ch. 10 - Describe three criteria for evaluating cost...
Ch. 10 - Define learning curve. Outline two models that can...Ch. 10 - Discuss four frequently encountered problems when...Ch. 10 - Prob. 10.13QCh. 10 - All the independent variables in a cost function...Ch. 10 - Multicollinearity exists when the dependent...Ch. 10 - HL Co. uses the high-low method to derive a total...Ch. 10 - A firm uses simple linear regression to forecast...Ch. 10 - In regression analysis, the coefficient of...Ch. 10 - A regression equation is set up, where the...Ch. 10 - What would be the approximate value of the...Ch. 10 - Estimating a cost function. The controller of the...Ch. 10 - Identifying variable-, fixed-, and mixed-cost...Ch. 10 - Various cost-behavior patterns. (CPA, adapted)....Ch. 10 - Matching graphs with descriptions of cost and...Ch. 10 - Account analysis, high-low. Stein Corporation...Ch. 10 - Account analysis method. Gower, Inc., a...Ch. 10 - Prob. 10.27ECh. 10 - Estimating a cost function, high-low method. Lacy...Ch. 10 - Linear cost approximation. Dr. Young, of Young and...Ch. 10 - Cost-volume-profit and regression analysis....Ch. 10 - Regression analysis, service company. (CMA,...Ch. 10 - High-low, regression. May Blackwell is the new...Ch. 10 - Learning curve, cumulative average-time learning...Ch. 10 - Learning curve, incremental unit-time learning...Ch. 10 - High-low method. Wayne Mueller financial analyst...Ch. 10 - High-low method and regression analysis. Market...Ch. 10 - High-low method; regression analysis. (CIMA,...Ch. 10 - Regression, activity-based costing, choosing cost...Ch. 10 - Interpreting regression results. Spirit...Ch. 10 - Cost estimation, cumulative average-time learning...Ch. 10 - Cost estimation, incremental unit-time learning...Ch. 10 - Regression; choosing among models. Apollo Hospital...Ch. 10 - Multiple regression (continuation of 10-42). After...Ch. 10 - Cost estimation. Hankuk Electronics started...Ch. 10 - Prob. 10.45PCh. 10 - Interpreting regression results, matching time...Ch. 10 - Purchasing department cost drivers, activity-based...Ch. 10 - Purchasing department cost drivers, multiple...
Knowledge Booster


Learn more about
Need a deep-dive on the concept behind this application? Look no further. Learn more about this topic, accounting and related others by exploring similar questions and additional content below.Similar questions
- The cost behavior patterns below are lettered A through H. The vertical axes of the graphs represent total dollars of expense, and the horizontal axes represent production in units, machine hours, or direct labor hours. In each case, the zero point is at the intersection of the two axes. Each graph may be used no more than once. Required: Select the graph that matches the lettered cost described here. a. Depreciation of equipmentthe amount of depreciation charged is computed based on the number of machine hours that the equipment was operated. b. Electricity billflat fixed charge, plus a variable cost after a certain number of kilowatt hours are used. c. City water billcomputed as follows: d. Depreciation of equipmentthe amount is computed by the straight-line method. e. Rent on a factory building donated by the citythe agreement calls for a fixed fee payment, unless 200,000 labor hours are worked, in which case no rent need be paid. f. Salaries of repair workersone repair worker is needed for every 1,000 machine hours or less (i.e., 0 to 1,000 hours requires one repair worker, 1,001 to 2,000 hours requires two repair workers, etc.).arrow_forwardUsing the data in P4-2 and Microsoft Excel: 1. Separate the variable and fixed elements. 2. Determine the cost to be charged to the product for the year. 3. Determine the cost to be charged to factory overhead for the year. 4. Determine the plotted data points using Chart Wizard. 5. Determine R2. 6. How do these solutions compare to the solutions in P4-2 and P4-3? 7. What does R2 tell you about this cost model?arrow_forwardHow can I prepare a product cost report (with it's supporting calculations) for department 1. Round average cost per equivalent unit to two decimal places. Use rounded answers for subsequent calculations. Round other answers to the nearest whole number.arrow_forward
- In the formula Y = a + bX, b represents the estimated Blank______. Multiple choice question. total fixed manufacturing overhead cost total manufacturing overhead cost total amount of the allocation base variable manufacturing overhead cost per unitarrow_forwardThe accompanying figures depict a number of cost behavior patterns that might be found in a company's cost structure. The vertical axis on each graph represents total cost, and the horizontal axis on each graph represents level of activity (volume). For each of the given situations, identify the graph that illustrates the cost pattern involved. Any graph may be used more than once. (Adapted originally from the CPA exam; also found in R.H. Garrison and E.W. Noreen, Managerial Acco11111ing, 9th edition, Irwin, 2009.)(a) Electricity bill-a flat-rate fixed charge plus a variable cost after a certainnumber of kilowatt-hours are used.(b) City water bill, which is computed as follows:First 1,000,000 gallons $1,000 flat, or lessNext 10,000 gallons $0.003 per gallon usedNext 10,000 gallons $0.006 per gallon usedNext 10,000 gallons $0.009 per gallon used(c) Depreciation of equipment, where the amount is computed…arrow_forwardMatch each of the terms/phrases numbered 1 through 5 with the best definition a through e. 1. Cost accounting system 2. Target cost 3. Job 4. Process operation 5. Job order production a. Production activities for a custom product. b. Production activities for a special order. c. A system that records manufacturing costs. d. The expected selling price of a job minus its desired profit. e. Mass production in a continuous flow of steps.arrow_forward
- Which of the following statements is true regarding the formula Y = a + bx? Multiple Choice Y = The estimated total fixed manufacturing overhead cost. Y = The estimated total amount of the allocation base. Y = The estimated total manufacturing overhead cost. Y = The actual total amount of the allocation base.arrow_forwardHow would I prepare a product cost report (with its supporting calculations) for Department 1. Round average cost per equivalent unit to two decimal places. Use rounded answers for subsequent calculations. Round other answers to the nearest whole number.arrow_forwardExamine the graphs in Exercise 3-40. Required: As explained in the chapter, cost behavior patterns can be described as fixed, variable, semi-variable, mixed, or step function (i.e., semi-fixed) in nature. Explain the exact type of cost behavior pattern represented by each of the cost curves shown in graphs A through L. Note that some of the graphs might represent a combination of multiple cost behavior patterns.arrow_forward
- Scattergraph method Using the data in P4-2 and a piece of graph paper: 1. Plot the data points on the graph and draw a line by visual inspection, indicating the trend shown by the data points. 2. Determine the variable cost per unit and the total fixed cost from the information on the graph. 3. Determine the variable cost to be charged to the product for the year. 4. Determine the fixed cost to be charged to factory overhead for the year. 5. Do these answers agree with the answers to P4-2? Why or why not?arrow_forwardUsing the data in E4-2 and spreadsheet software, determine: The variable cost per unit, the total fixed cost, and R2. The plotted data points using the graphing function. Compare the results to your solutions in E4-2 and E4-3 and explain the reasons for the results.arrow_forwardAssuming that all materials are added at the beginning of the process and that labor and factory overhead are applied evenly during the process, compute the figures to be inserted in the blank spaces of the following data, using the weighted average cost method. [Hint: for best success in solving each Case, solve them in numerical order starting with (1)]arrow_forward
arrow_back_ios
SEE MORE QUESTIONS
arrow_forward_ios
Recommended textbooks for you
 Principles of Cost AccountingAccountingISBN:9781305087408Author:Edward J. Vanderbeck, Maria R. MitchellPublisher:Cengage Learning
 Managerial Accounting: The Cornerstone of Busines...AccountingISBN:9781337115773Author:Maryanne M. Mowen, Don R. Hansen, Dan L. HeitgerPublisher:Cengage Learning
Principles of Cost Accounting
Accounting
ISBN:9781305087408
Author:Edward J. Vanderbeck, Maria R. Mitchell
Publisher:Cengage Learning
Managerial Accounting: The Cornerstone of Busines...
Accounting
ISBN:9781337115773
Author:Maryanne M. Mowen, Don R. Hansen, Dan L. Heitger
Publisher:Cengage Learning
What is variance analysis?; Author: Corporate finance institute;https://www.youtube.com/watch?v=SMTa1lZu7Qw;License: Standard YouTube License, CC-BY