
A
To describe:Based on the given data and information, prove that the P=3 is the
A
Answer to Problem 1.2P
If there is a rise in the
Explanation of Solution
| Quantity Supplied | Quantity Demanded | |
| 1 | 100 | 700 |
| 2 | 300 | 600 |
| 3 | 500 | 500 |
| 4 | 700 | 400 |
| 5 | 900 | 300 |
By observing the above table, it can be seen that at a market price of 3, the quantity supplied equals to the quantity demanded. Hence, the equilibrium price is 3.
Introduction: The price at which the quantity of goods supplied is equal to the quantity of goods supplied is referred to as the market price.
B
To describe:
Based on the given and arrived at data, find out the reasons behind the prices 2 and 4 not being equilibrium prices.
B
Answer to Problem 1.2P
If there is a fall in the demand for the e-book as it is following the change in the prices of e-books it would result in an increase of complement.
Explanation of Solution
| Price | Quantity Supplied | Quantity Demanded |
| 1 | 100 | 700 |
| 2 | 300 | 600 |
| 3 | 500 | 500 |
| 4 | 700 | 400 |
| 5 | 900 | 300 |
By observing the above table, at a price of 2 the quantity supplied is lower than the quantity demanded, and hence it is not the equilibrium price.
Similarly, at the price of 4, the quantity demanded is more than the quantity supplied, and hence it is not the equilibrium price.
Introduction: The price at which the quantity of goods supplied is equal to the quantity of goods supplied is referred to as the market price.
C
To describe:
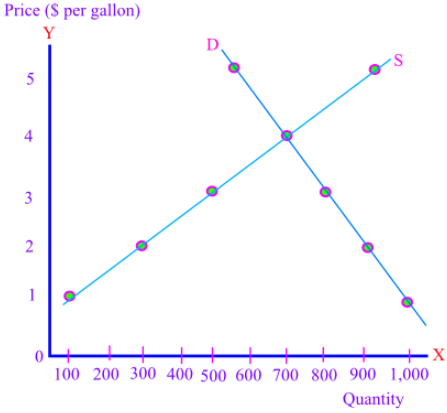
Graph the results of previous parts and show that the equilibrium price is achieved.
C
Answer to Problem 1.2P
If there is a rise in the demand for tablet devices which can eventually be following a change in the price of ultrathin laptop computers, that also happen to be the substitutes can result in increase in pricing.
Explanation of Solution
Upon observing the graph, as usual, it can be noticed that the supply curve and demand curve are intersecting at a price level of 3.
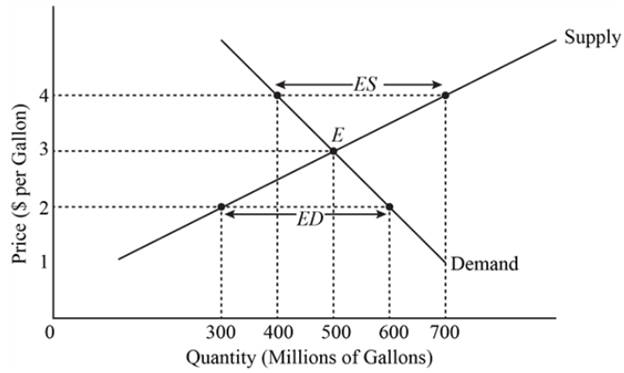
Hence, it can be concluded that the equilibrium price is 3.
Introduction: The price at which the quantity of goods supplied is equal to the quantity of goods supplied is referred to as the market price.
D
To describe:
Supposing the given assumption, possibility of the change in the data given in earlier problem.
D
Answer to Problem 1.2P
If there is also a fall in the demand for physical books it can result in following a change in the price of e-books which are also substitutes can result in the decrease of the prices.
Explanation of Solution
Provided that the people now are demanding 300 more quantity at every price change, the demand will be changed and can be observed in the given table:
| Price | Quantity Supplied | Quantity Demanded |
| 1 | 100 | 1000 |
| 2 | 300 | 900 |
| 3 | 500 | 800 |
| 4 | 700 | 700 |
| 5 | 900 | 600 |
In the resulting graph as shown below, the change in the quantity demanded would shift the demand curve outward:
Introduction: The price at which the quantity of goods supplied is equal to the quantity of goods supplied is referred to as the equilibrium price.
E
To describe:
Given the proposed change in the demand, outline the result in the graph.
E
Answer to Problem 1.2P
If there is also a fall in the demand for physical books it can result in following a change in the price of e-books which are also substitutes can result in the decrease of the prices.
Explanation of Solution
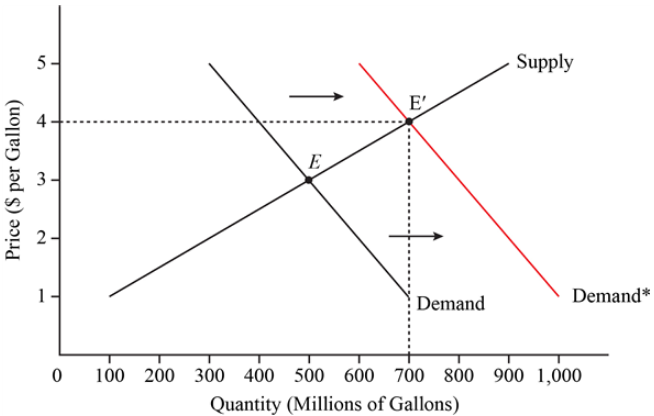
The proposed increase in the demand would change the equilibrium to new equilibrium represented by E1, for the new equilibrium price of P=4.
Introduction: The price at which the quantity of goods supplied is equal to the quantity of goods supplied is referred to as the equilibrium price.
F
To describe:
Find out the change in pattern for the given supply demanded.
F
Answer to Problem 1.2P
If there is also a fall in the demand for physical books it can result in following a change in the price of e-books which are also substitutes can result in the decrease of the prices.
Explanation of Solution
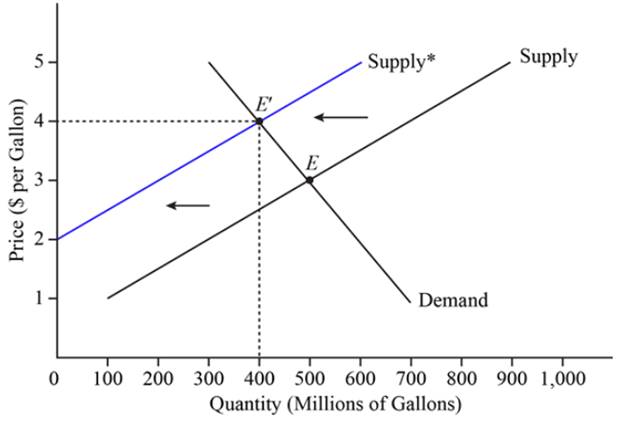
With the given new supply demanded at every price, observe the given table for the resulting changes:
| Price | Quantity Supplied | Quantity Demanded |
| 1 | 0 | 700 |
| 2 | 0 | 600 |
| 3 | 200 | 500 |
| 4 | 400 | 400 |
| 5 | 600 | 300 |
Such a change in the supply pattern would shift the supply curve to the inward.
Introduction: The price at which the quantity of goods supplied is equal to the quantity of goods supplied is referred to as the equilibrium price.
G
To describe:
Find out the equilibrium price in the market with the new supply relationship together with the demand relationship.
G
Answer to Problem 1.2P
If there is also a fall in the demand for physical books it can result in following a change in the price of e-books which are also substitutes can result in the decrease of the prices.
Explanation of Solution
With the given new supply demanded at every price, observe the given table for the resulting changes:
| Price | Quantity Supplied | Quantity Demanded |
| 1 | 0 | 700 |
| 2 | 0 | 600 |
| 3 | 200 | 500 |
| 4 | 400 | 400 |
| 5 | 600 | 300 |
The new equilibrium price would be P=4, at the given quantity supplied and the quantity demanded.
Introduction: The price at which the quantity of goods supplied is equal to the quantity of goods supplied is referred to as the equilibrium price.
H
To describe:
With the new demand and supply quantity relationships, observe the change in equilibrium price.
H
Answer to Problem 1.2P
If there is also a fall in the demand for physical books it can result in following a change in the price of e-books which are also substitutes can result in the decrease of the prices.
Explanation of Solution
With the reduce in the supply and excess of demand at P=3, the result is that it is no more an equilibrium price.
This because, the supply and demand are not any more the same for the given price, and hence, the price is not any more an equilibrium price.
Introduction: The price at which the quantity of goods supplied is equal to the quantity of goods supplied is referred to as the equilibrium price.
I
To describe:
For the observed results at the supply shift, put out a graph.
I
Answer to Problem 1.2P
If there is also a fall in the demand for physical books it can result in following a change in the price of e-books which are also substitutes can result in the decrease of the prices.
Explanation of Solution
Introduction: The price at which the quantity of goods supplied is equal to the quantity of goods supplied is referred to as the equilibrium price.
Want to see more full solutions like this?
Chapter 1 Solutions
EBK INTERMEDIATE MICROECONOMICS AND ITS

- In the week-4 materials, when deriving labour supply, we assumed that the substitution effect dominated the income effect. What impact would there be on labour supply if this was not the case? Briefly investigate how such a change could theoretically affect the imposition of a minimum wage above the market clearing wage. (Your answer is likely to benefit from diagrammatic support.)arrow_forwardRefer to the attached Wk 3 Graph for this assignment. The graph shows an increase in demand (shifting of the demand curve from D1 to D2). Choose an application or situation in the economy or a specific economic situation to describe this graph. Take into consideration the impact on quantity and price in your analysis. Given your analysis, what would cause the situation to go the opposite way? What would cause the situation to go further into the same direction?arrow_forwardClick on the link to study the Economics in the News. Then answer the following questions. 120- 118- 3. Use the AS-AD model to show the changes in aggregate demand and aggregate supply that occurred in 2016 and 2017 that brought the economy to its situation in mid-2017. The graph shows the U.S. economy in the second quarter of 2016. Draw and label the long-run aggregate supply curve in 2017. Draw and label the aggregate demand curve in 2017. Draw a point at the short-run macroeconomic equilibrium in the second quarter of 2017. 116- 114- ☑--- Price level (GDP deflator, 2009=100) LAS 16 112- 110- 108- 106- 104- 102- $16.7 100- 16.6 16.7 16.8 16.9 17.0 SAS 16 = SAS17 AD 16 17.1 17.2 17.3 Real GDP (trillions of 2009 dollars) >>> Draw only the objects specified in the question. LV ☑arrow_forward
- Price level (GDP deflator, 2009=100) Fed Raises Rates As Job Gains, Firming Inflation Stoke Confidence The U.S. Federal Reserve raised interest rates on Wednesday. The rate rise was the second in three months. This second rise comes in an economy that is growing faster and creating jobs at a more rapid pace. These gains are accompanied by a rising inflation rate. 140- 130- Source: Reuters, March 15, 2017 Describe the process by which the Fed's action reported in the news clip flows through the economy. 120- ... 110- LAS SAS → ☑ When the Fed raises the interest rate, A. aggregate demand decreases and short-run aggregate supply increases, and the price level falls B. aggregate demand increases and real GDP increases C. aggregate demand decreases and the price level falls D. short-run aggregate supply increases and the price level falls The graph shows the long-run aggregate supply curve and the short-run aggregate supply curve. Draw the AD curve to illustrate the state of the economy…arrow_forwardPrice level (GDP deflator, 2009=100) Millennials Are Starting to Spend More Millennials, who spend an average of $85 a day, are expected to spend at a higher rate in the next fifteen years. Only 37 percent of Americans report higher spending today than a year ago, while 42 percent of millennials say they are spending more. Millennials are spending more on rent or mortgages and leisure activities than they were spending a year ago. 140- 130- Source: Business Journal, May 25, 2016 120- Describe the macroeconomic equilibrium after the change in spending by millennials. If the economy had been at a below full-employment equilibrium, then the economy will A. move to an above full-employment equilibrium with real GDP less than potential GDP B. move to a full-employment equilibrium as short-run aggregate supply increases at the same time 'C. move to a full-employment equilibrium and equilibrium real GDP equals potential GDP D. remain stuck in a below full-employment equilibrium If the economy…arrow_forwardWolfgang is a typical producer in a perfectly competitive piano industry (i.e., all other producers of pianos face the same costs as Wolfgang). The following production and cost data apply to the long run as well as the short run. Fixed costs (rent) are unrecoverable in the short run and are equal to $2400 per month. Variable costs consist of raw materials (wire, wood, plastic), which cost $1000 per piano, and the $40 per hour opportunity cost of Wolfgang's time. Wolfgang's production function is given in the table at right. Wolfgang will shut down if the price per piano is less than OA. $3000. B. $4000. O C. $5000. ○ D. None of the above. Pianos (Q) Hours (L) Raw Materials ( 0 0 0 1 100 1000 2 150 2000 3 240 3000 4 400 4000arrow_forward
- P2 P₁ $ per unit Using the graph below, determine which statement is TRUE. MC1 SRATC₁ Q1 Q₂ MC2 SRATC2 LRAC ✓ LEA Quantityarrow_forwardUsing the grapns below, wnicn snow the snort-run cost curves for 3 perfectly competitive firms in the same industry, determine whether the industry is in long-run equilibrium or not. Q Q Firm A QA MC ATC Output Firm B QB MC ATC Firm C MC ATC Output Output Qc If Firms A, B and C are in the same industry, is this industry in long-run equilibrium? ○ A. Yes, because P = MC = MR for each of the 3 firms. ○ B. No, because Firm A is not producing at a profit-maximizing level of output. ○ C. Yes, because all 3 firms are producing at their minimum average total cost. OD. The answer is uncertain since it's unknown whether the firms are producing at the minimum efficient scale or not. ○ E. No, because if the industry were in equilibrium, all 3 firms would be earning zero economic profits.arrow_forwardConsider the table on the right, which shows the various revenue concepts for a perfectly competitive firm. Suppose the firm faces a constant market price of $4. Compute first total revenue for each level of output and fill in the TR column of the table. Next, compute marginal revenue for each level of output and fill in the MR column of the table. (Marginal revenue at each level of output is computed using total revenue for two successive levels of output. For example, marginal revenue at 160 uses total revenue for output levels 120 and 160.) Total Marginal Price (p)Quantity (Q) Revenue (TR)Revenue (MR) $4 A EA 120 $4 160 $4 200 $4 240 $4 280 $ EA EA EA 10 S คarrow_forward
- This week we will be discussing measures of economic well-being. Read the following short article from the Office of National Statistics from the U.K. which discusses different measures of economic well-being: https://blog.ons.gov.uk/2017/07/06/beyond-gdp-measuring-the-economic-well-being-of-individuals/ For this assignment, we will narrow down to the economic well-being of the St. Louis region (or another region you choose). As the article indicates there are different measures of well-being. You are interested in creating a Hypothesis Test about the economic well-being of the area. Discuss the following issues: First, think about your research hypothesis and justify it briefly. Remember, a hypothesis is a well-thought and untested proposition. What is the null hypothesis? What is the parameter you are interested in? (i.e., the measure of well-being). Is it going to be a Lower-Tail, Upper-Tail or Two-Tailed test? What is the data that you need and how will you collect the data? What…arrow_forwardJohnny brought $39.50 to the art supply store. He bought a brush, a sketchbook, and a paint set. The brush was 1 6 as much as the sketchbook, and the sketchbook cost 3 4 the cost of the paint set. Johnny had $2.00 left over after buying these items.arrow_forwardA young woman plans to retire early in 25 years. She believes she can save $10,000 each year starting now. If she plans to begin withdrawing money one year after she makes her last payment into the retirement account (i.e., in the 26th year), what uniform amount could she withdraw each year for 30 years, if the account earns an interest rate of 8% per year? a) Correctly plot the cash flow diagram with its respective vectors, arrowheads, units, and currency values. b) Correct mathematical approach and development, use of compound interest factors.c) Financial logic in the development of the exercise and application of the concept of time value of money. d) Final numerical answer and writing in prose with a minimum of 20 words and a maximum of 50 words of the obtained numerical interpretation.arrow_forward
 Exploring EconomicsEconomicsISBN:9781544336329Author:Robert L. SextonPublisher:SAGE Publications, Inc
 Economics (MindTap Course List)EconomicsISBN:9781337617383Author:Roger A. ArnoldPublisher:Cengage Learning

 Survey of Economics (MindTap Course List)EconomicsISBN:9781305260948Author:Irvin B. TuckerPublisher:Cengage Learning