MATLAB: An Introduction with Applications
6th Edition
ISBN: 9781119256830
Author: Amos Gilat
Publisher: John Wiley & Sons Inc
expand_more
expand_more
format_list_bulleted
Concept explainers
Topic Video
Question
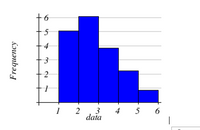
What is the best description of the shape of the data below?
|
Bell-shaped |
||
|
Skewed right |
||
|
Skewed left |

Transcribed Image Text:+6
-4
1
3
2
data
4 5 6
Frequency
Expert Solution
This question has been solved!
Explore an expertly crafted, step-by-step solution for a thorough understanding of key concepts.
Step by stepSolved in 2 steps

Knowledge Booster
Learn more about
Need a deep-dive on the concept behind this application? Look no further. Learn more about this topic, statistics and related others by exploring similar questions and additional content below.Similar questions
- What are 2 situations when you will use median as a measure of central tendency.arrow_forwardDefine the Test a slope for significance?arrow_forwardCan you find a set of data such that the mean, median, and variance are all equal to each other? Find as many data sets as possible. If none are possible, explain why. If many are possible explain why. If you find any patterns explain what they are and how they are useful in the hunt for understanding this question.arrow_forward
- Which of the following is NOT an appropriate display for the variable of Grade Point Average? Group of answer choices Dot Plot Scatterplot Boxplot Stem and Leaf Plot Histogramarrow_forwardYou want to construct a stem-and-leaf plot for the following data set. What would be the "leaves" for the "stem" of 7? You should express your answer as a single multiple-digit number. For example, 5899, but not 5 8 9 9 (i.e., with spaces between the numbers). Remember to put the entries in order.arrow_forwardWhich is the line of best fit for the data shown in the table? y 2 4 6. 6. 8. 8. 9. 9. O y = 0.72x+3.04 O y = 2.68x + 0.75 O y = 0.75x+ 2.68 O y = 2.68x + 0.70 96 XHN456arrow_forward
- MAT 312 PLEASE HELP After being hired as a financial advisor for a large real estate company, you have been tasked with exploring trends between home size (square ft) and property taxes to see if a relationship exists and if that trend can be applied outside of just the sample data. In the Excel Lab #5 Data File, you will find raw data on sheet 1. However, to simplify your calculations, you have only been asked to test a random sample of 10 homes. So, your first step will be to randomly select data from 10 of the homes and paste them into sheet 2 called “sample data”. This will be the data that you will analyze. (You can generate 10 random numbers between 5 and 30 however you want for your sample, but know that there is essentially no chance two students should have the same 10 samples). Within the Excel spreadsheet, use the Excel tools/functions to calculate the correlation coefficient, test statistic, and p-value. You will also use Excel to generate a scatterplot of your sample data…arrow_forwardExplain the meaning of the specified term. Distribution of a data setarrow_forwardLetter (d) Would i be wrong if i said yes the data set consisting of the annual salary for each employee at the MNM company is a population since no employee salary is excluded from the dataarrow_forward
- Summarize the effect different kinds of outliers can have on a data set in terms of how we interpret whether we have a good model or not.arrow_forwardWhat is the median?arrow_forwardThe histogram describes the height of students in a math class. Is the data univariate or bivariate? Is the skewness left, right, or normal?arrow_forward
arrow_back_ios
SEE MORE QUESTIONS
arrow_forward_ios
Recommended textbooks for you
 MATLAB: An Introduction with ApplicationsStatisticsISBN:9781119256830Author:Amos GilatPublisher:John Wiley & Sons Inc
 Probability and Statistics for Engineering and th...StatisticsISBN:9781305251809Author:Jay L. DevorePublisher:Cengage Learning
 Statistics for The Behavioral Sciences (MindTap C...StatisticsISBN:9781305504912Author:Frederick J Gravetter, Larry B. WallnauPublisher:Cengage Learning
 Elementary Statistics: Picturing the World (7th E...StatisticsISBN:9780134683416Author:Ron Larson, Betsy FarberPublisher:PEARSON
 The Basic Practice of StatisticsStatisticsISBN:9781319042578Author:David S. Moore, William I. Notz, Michael A. FlignerPublisher:W. H. Freeman
 Introduction to the Practice of StatisticsStatisticsISBN:9781319013387Author:David S. Moore, George P. McCabe, Bruce A. CraigPublisher:W. H. Freeman

MATLAB: An Introduction with Applications
Statistics
ISBN:9781119256830
Author:Amos Gilat
Publisher:John Wiley & Sons Inc

Probability and Statistics for Engineering and th...
Statistics
ISBN:9781305251809
Author:Jay L. Devore
Publisher:Cengage Learning

Statistics for The Behavioral Sciences (MindTap C...
Statistics
ISBN:9781305504912
Author:Frederick J Gravetter, Larry B. Wallnau
Publisher:Cengage Learning

Elementary Statistics: Picturing the World (7th E...
Statistics
ISBN:9780134683416
Author:Ron Larson, Betsy Farber
Publisher:PEARSON

The Basic Practice of Statistics
Statistics
ISBN:9781319042578
Author:David S. Moore, William I. Notz, Michael A. Fligner
Publisher:W. H. Freeman

Introduction to the Practice of Statistics
Statistics
ISBN:9781319013387
Author:David S. Moore, George P. McCabe, Bruce A. Craig
Publisher:W. H. Freeman