MATLAB: An Introduction with Applications
6th Edition
ISBN: 9781119256830
Author: Amos Gilat
Publisher: John Wiley & Sons Inc
expand_more
expand_more
format_list_bulleted
Question
Please see below. I need this asap please and thank you. Need these asap.

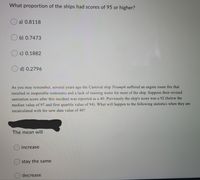
Transcribed Image Text:What proportion of the ships had scores of 95 or higher?
a) 0.8118
b) 0.7473
c) 0.1882
O d) 0.2796
As you may remember, several years ago the Carnival ship Triumph suffered an engine room fire that
resulted in inoperable restrooms and a lack of running water for most of the ship. Suppose their revised
sanitation score after this incident was reported as a 40. Previously the ship's score was a 92 (below the
median value of 97 and first quartile value of 94). What will happen to the following statistics when they are
recalculated with the new data value of 40?
The mean will
increase
stay the same
decrease

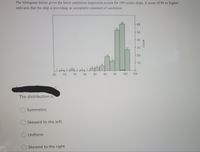
Transcribed Image Text:The histogram below gives the latest sanitation inspection scores for 186 cruise ships. A score of 86 or higher
indicates that the ship is providing an acceptable standard of sanitation.
F60
50
40
-30
20
12
10
65
70
75
80
85
90
95
100
105
The distribution is
Symmetric
Skewed to the left
Uniform
Skewed to the right
Count
Expert Solution
arrow_forward
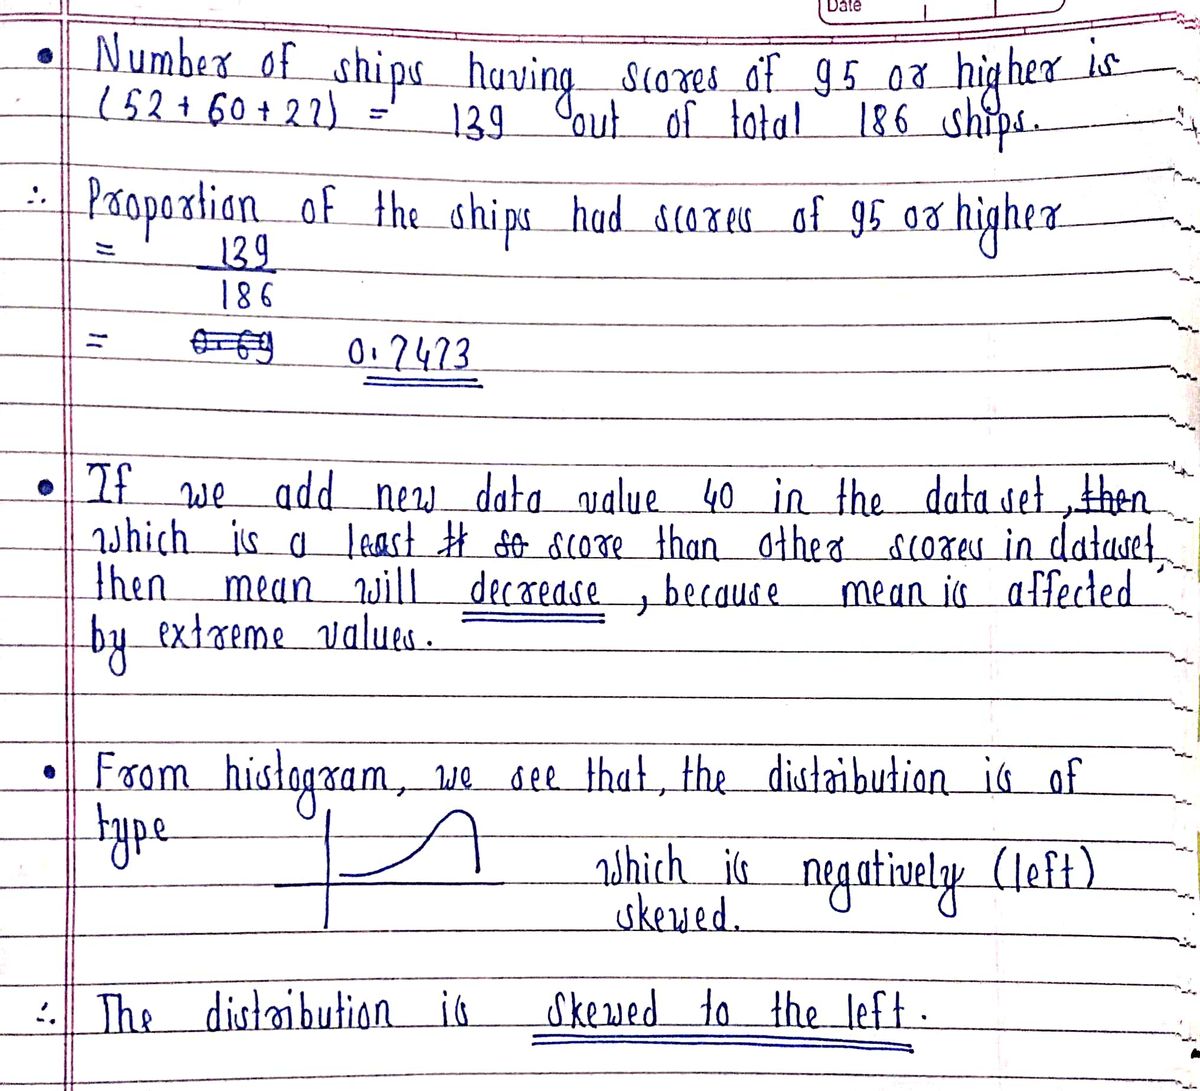
Step 1

Trending nowThis is a popular solution!
Step by stepSolved in 2 steps with 1 images

Knowledge Booster
Similar questions
- Sheet5 contains data for fitness purchases. Create a line chart, a stacked line chart, a 100% stacked line to compare the purchases by different age groups each year with the US population. Place the three charts in the same worksheet as the source data. Include appropriate titles and a legend in each chart. In a cell below each char, explain what you think the chart illustratesarrow_forwardbefore you look at the can you're friend says, "i didn't know you drank selzterarrow_forwardA box of 25 light bulbs is shipped to a hardware store. When it arrives, four of the bulbs are broken. Predict the number of broken light bulbs in an order of 125 bulbs.arrow_forward
- Fire departments in your county have an average benchmark of 6 minutes on a fire call from the time the 911 operator takes the call to the time the first firefighter arrives on the scene. This 6-minute average includes a 1-minute call handling time from when 911 gets the call to when they notify the fire department. There is a 1-minute time from when the firefighters are notified to when they get out of the fire station. Then they have 4 minutes from when they leave the station to when they arrive on scene. Two fire departments in your county are being compared. From one fire department, a random sample of 10 calls has a mean of 6.51 minutes total with a standard deviation of 0.26 minutes. From the other fire department, a random sample of 11 calls shows a mean of 6.42 minutes with a standard deviation of 0.19. Construct a 90% confidence interval for the difference in the mean call time between the two fire departments. Fire departments in your county have an average benchmark of 6…arrow_forwardThere are three condiments available to make a sandwich. How many ways can you make a sandwich using exactly two of the condiments? Explain your answer.arrow_forwardThe chaperones for an upcoming junior high dance want to see which soda to serve. They ask 50 students to fill out a survey about their favorite sodas. If 32 out of 50 students prefer root beer, how many of the 150 dance attendees would you expect to prefer root beer? Be sure to show all of your work. Use the paperclip button below to attach files.arrow_forward
arrow_back_ios
arrow_forward_ios
Recommended textbooks for you
 MATLAB: An Introduction with ApplicationsStatisticsISBN:9781119256830Author:Amos GilatPublisher:John Wiley & Sons Inc
 Probability and Statistics for Engineering and th...StatisticsISBN:9781305251809Author:Jay L. DevorePublisher:Cengage Learning
 Statistics for The Behavioral Sciences (MindTap C...StatisticsISBN:9781305504912Author:Frederick J Gravetter, Larry B. WallnauPublisher:Cengage Learning
 Elementary Statistics: Picturing the World (7th E...StatisticsISBN:9780134683416Author:Ron Larson, Betsy FarberPublisher:PEARSON
 The Basic Practice of StatisticsStatisticsISBN:9781319042578Author:David S. Moore, William I. Notz, Michael A. FlignerPublisher:W. H. Freeman
 Introduction to the Practice of StatisticsStatisticsISBN:9781319013387Author:David S. Moore, George P. McCabe, Bruce A. CraigPublisher:W. H. Freeman

MATLAB: An Introduction with Applications
Statistics
ISBN:9781119256830
Author:Amos Gilat
Publisher:John Wiley & Sons Inc

Probability and Statistics for Engineering and th...
Statistics
ISBN:9781305251809
Author:Jay L. Devore
Publisher:Cengage Learning

Statistics for The Behavioral Sciences (MindTap C...
Statistics
ISBN:9781305504912
Author:Frederick J Gravetter, Larry B. Wallnau
Publisher:Cengage Learning

Elementary Statistics: Picturing the World (7th E...
Statistics
ISBN:9780134683416
Author:Ron Larson, Betsy Farber
Publisher:PEARSON

The Basic Practice of Statistics
Statistics
ISBN:9781319042578
Author:David S. Moore, William I. Notz, Michael A. Fligner
Publisher:W. H. Freeman

Introduction to the Practice of Statistics
Statistics
ISBN:9781319013387
Author:David S. Moore, George P. McCabe, Bruce A. Craig
Publisher:W. H. Freeman