
MATLAB: An Introduction with Applications
6th Edition
ISBN: 9781119256830
Author: Amos Gilat
Publisher: John Wiley & Sons Inc
expand_more
expand_more
format_list_bulleted
Related questions
Concept explainers
Question
please answer the question in the photo. Thank you
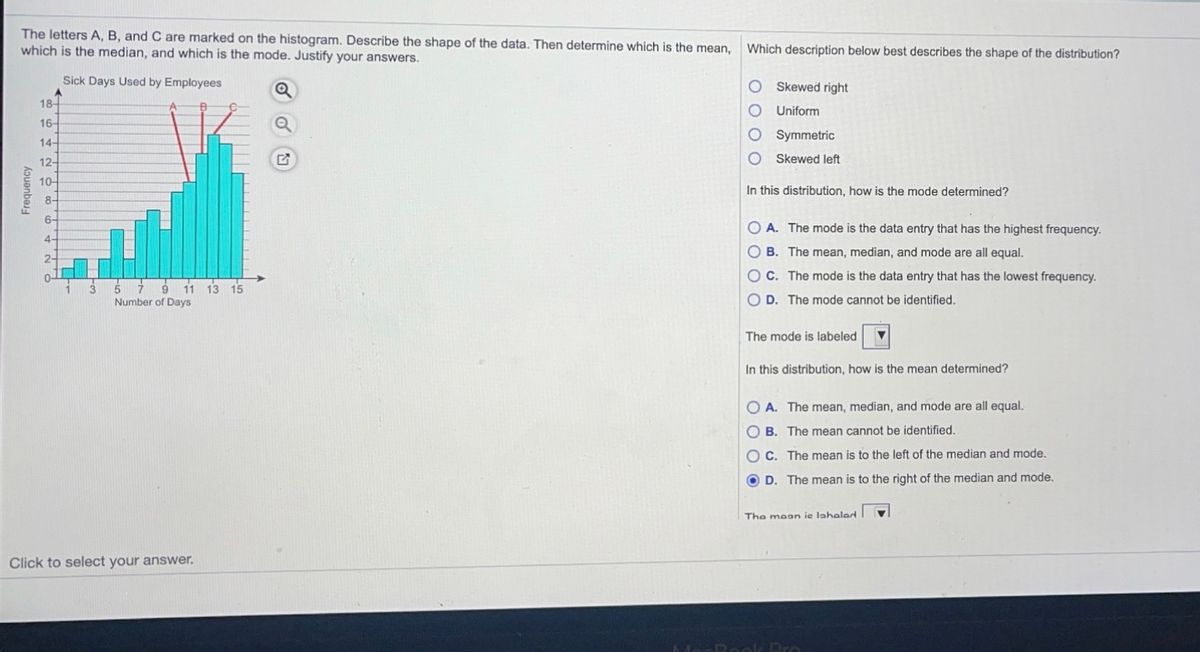

Transcribed Image Text:The letters A, B, and C are marked on the histogram. Describe the shape of the data. Then determine which is the mean,
which is the median, and which is the mode. Justify your answers.
Which description below best describes the shape of the distribution?
Sick Days Used by Employees
Skewed right
18-
Uniform
16-
Symmetric
14-
12-
O Skewed left
10-
In this distribution, how is the mode determined?
8-
6-
O A. The mode is the data entry that has the highest frequency.
4-
O B. The mean, median, and mode are all equal.
2-
0-
O C. The mode is the data entry that has the lowest frequency.
3.
5 7 9 11 13 15
Number of Days
O D. The mode cannot be identified.
The mode is labeled
In this distribution, how is the mean determined?
O A. The mean, median, and mode are all equal.
O B. The mean cannot be identified.
O C. The mean is to the left of the median and mode.
O D. The mean is to the right of the median and mode.
The mean ie lahalar
Click to select your answer.
Peok PrO
Frequency
Expert Solution
This question has been solved!
Explore an expertly crafted, step-by-step solution for a thorough understanding of key concepts.

This is a popular solution

Trending nowThis is a popular solution!

Step by stepSolved in 2 steps

Knowledge Booster


Learn more about
Need a deep-dive on the concept behind this application? Look no further. Learn more about this topic, statistics and related others by exploring similar questions and additional content below.Similar questions
- A basketball is approximately one-tenth the size of an inflated beachball. If the diameter of a basketball is 9.4 inches, what would be the diameter of an inflated beach ball? Use the place value chart to justify your answer.arrow_forwardA retailer buys a skirt for $17 that has a markup of $19. What is the retail price?arrow_forwardI need to have d, e, and f checked please.arrow_forward
- p= $956.28, r= 4.5, t=?, i= $172.13arrow_forwardAn art museum owns a painting that it would like to reproduce in reduced size onto a 24-inch by-36-inch poster. The painting is 85 inches by 140 inches. Give your recommendation for the size of the reproduced painting on the poster- how wide and long do you suggest that it be? Draw a scale picture showing how you would position the reproduced painting on the poster. Explain your reasoning.arrow_forward
arrow_back_ios
arrow_forward_ios
Recommended textbooks for you
- MATLAB: An Introduction with ApplicationsStatisticsISBN:9781119256830Author:Amos GilatPublisher:John Wiley & Sons Inc
 Probability and Statistics for Engineering and th...StatisticsISBN:9781305251809Author:Jay L. DevorePublisher:Cengage Learning
 Statistics for The Behavioral Sciences (MindTap C...StatisticsISBN:9781305504912Author:Frederick J Gravetter, Larry B. WallnauPublisher:Cengage Learning
  Elementary Statistics: Picturing the World (7th E...StatisticsISBN:9780134683416Author:Ron Larson, Betsy FarberPublisher:PEARSON
 The Basic Practice of StatisticsStatisticsISBN:9781319042578Author:David S. Moore, William I. Notz, Michael A. FlignerPublisher:W. H. Freeman
 Introduction to the Practice of StatisticsStatisticsISBN:9781319013387Author:David S. Moore, George P. McCabe, Bruce A. CraigPublisher:W. H. Freeman
MATLAB: An Introduction with Applications
Statistics
ISBN:9781119256830
Author:Amos Gilat
Publisher:John Wiley & Sons Inc
Probability and Statistics for Engineering and th...
Statistics
ISBN:9781305251809
Author:Jay L. Devore
Publisher:Cengage Learning
Statistics for The Behavioral Sciences (MindTap C...
Statistics
ISBN:9781305504912
Author:Frederick J Gravetter, Larry B. Wallnau
Publisher:Cengage Learning
Elementary Statistics: Picturing the World (7th E...
Statistics
ISBN:9780134683416
Author:Ron Larson, Betsy Farber
Publisher:PEARSON
The Basic Practice of Statistics
Statistics
ISBN:9781319042578
Author:David S. Moore, William I. Notz, Michael A. Fligner
Publisher:W. H. Freeman
Introduction to the Practice of Statistics
Statistics
ISBN:9781319013387
Author:David S. Moore, George P. McCabe, Bruce A. Craig
Publisher:W. H. Freeman