MATLAB: An Introduction with Applications
6th Edition
ISBN: 9781119256830
Author: Amos Gilat
Publisher: John Wiley & Sons Inc
expand_more
expand_more
format_list_bulleted
Question
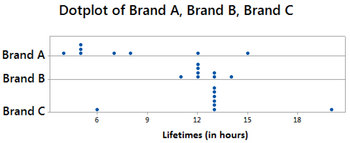
Which of the three brands had the smallest

Transcribed Image Text:Brand A
Brand B
Brand C
Dotplot of Brand A, Brand B, Brand C
• 60
9
12
15
Lifetimes (in hours)
18
Expert Solution
This question has been solved!
Explore an expertly crafted, step-by-step solution for a thorough understanding of key concepts.
Step by stepSolved in 3 steps

Knowledge Booster
Similar questions
- The accompanying histogram is for pulse rates for 125 people. Convert the vertical axis to relative frequency and shows the values that would replace each of the values on the vertical axis.arrow_forwardwhy do you think the data presented this way?arrow_forwardExplain what a box and whisker plot is and how we use it to understand central tendency and variability.arrow_forward
- Max scored an 80 on her psychology quiz, but the class as a whole averaged a 40. If the standard deviation was 10, what was Alicia's z-score?arrow_forwardThe ages (in years)and heights (in inches) of all pitchers for a baseball team are listed. Find the cofficient of a variation for each of the two data sets. Then compare the result.arrow_forwardMembers of the student council are seling bagels during each class period of the school day for a fundrasier. Yu-na made a scatter plot to see if there was a relationship between the class period and the number of bagels sold.Yu-na draws a line of best fit. Which of these lines is the best model for the data?arrow_forward
- Several years ago, the state of California launched an aggressively advertisement campaign against smoking. We've interviewed students from 16 college campuses in California and recorded for each campus the percentage of students who claimed that they had encountered assay least one anti smoking advertisement on campus in the past month. Here are those percentages. 53 39 30 49 48 42 41 38 26 36 40 42 52 51 45 50 Construct a box and whisker plot for the data.arrow_forwardFind a best-fit line for the following 5 data points. Please state the equation of the line, and give the error vector. 2|3 3 3 45arrow_forwardSurveys always provide data that is 100% accurate from feedback from participants True or Falsearrow_forward
- Nicole has a popular blog about cooking and nutrition and regularly posts articles and videos. She has collected data about the length of time that viewers spent watching two of her recent videos. For each video, she recorded the amount of time (in minutes) that each of 102 viewers spent watching it. The histograms below show the distributions of the two data sets. Each histogram shows time (in minutes) on the horizontal axis and the number of viewers on the vertical axis. The means and standard deviations for the data sets are also given. Video 1 Video 2 25- 25- 20- 20- 15- 15- 10- 10- 5- 5- 0- 19.5 24.5 29.5 34.5 39.5 44.5 49.5 54.5 59.5 64.5 69.5 19.5 24.5 29.5 34.5 39.5 44.5 49.5 54.5 59.5 64.5 69.5 Video 1 mean: 52.05 minutes Video 2 mean: 44.25 minutes Video 1 standard deviation: 12.54 minutes Video 2 standard deviation: 8.16 minutes Nicole wants to use the Empirical Rule to make some approximations about both data sets. Unfortunately, it is appropriate to use the Empirical Rule…arrow_forwardFind the 5 number summary for the data shown 17 21 29 30 36 42 56 60 88 91 94 97 5 number summary:Use the Locator/Percentile method described in your book, not your calculator.arrow_forwardThis is only one questionarrow_forward
arrow_back_ios
SEE MORE QUESTIONS
arrow_forward_ios
Recommended textbooks for you
 MATLAB: An Introduction with ApplicationsStatisticsISBN:9781119256830Author:Amos GilatPublisher:John Wiley & Sons Inc
 Probability and Statistics for Engineering and th...StatisticsISBN:9781305251809Author:Jay L. DevorePublisher:Cengage Learning
 Statistics for The Behavioral Sciences (MindTap C...StatisticsISBN:9781305504912Author:Frederick J Gravetter, Larry B. WallnauPublisher:Cengage Learning
 Elementary Statistics: Picturing the World (7th E...StatisticsISBN:9780134683416Author:Ron Larson, Betsy FarberPublisher:PEARSON
 The Basic Practice of StatisticsStatisticsISBN:9781319042578Author:David S. Moore, William I. Notz, Michael A. FlignerPublisher:W. H. Freeman
 Introduction to the Practice of StatisticsStatisticsISBN:9781319013387Author:David S. Moore, George P. McCabe, Bruce A. CraigPublisher:W. H. Freeman

MATLAB: An Introduction with Applications
Statistics
ISBN:9781119256830
Author:Amos Gilat
Publisher:John Wiley & Sons Inc

Probability and Statistics for Engineering and th...
Statistics
ISBN:9781305251809
Author:Jay L. Devore
Publisher:Cengage Learning

Statistics for The Behavioral Sciences (MindTap C...
Statistics
ISBN:9781305504912
Author:Frederick J Gravetter, Larry B. Wallnau
Publisher:Cengage Learning

Elementary Statistics: Picturing the World (7th E...
Statistics
ISBN:9780134683416
Author:Ron Larson, Betsy Farber
Publisher:PEARSON

The Basic Practice of Statistics
Statistics
ISBN:9781319042578
Author:David S. Moore, William I. Notz, Michael A. Fligner
Publisher:W. H. Freeman

Introduction to the Practice of Statistics
Statistics
ISBN:9781319013387
Author:David S. Moore, George P. McCabe, Bruce A. Craig
Publisher:W. H. Freeman