
Fundamentals of Financial Management (MindTap Course List)
15th Edition
ISBN: 9781337395250
Author: Eugene F. Brigham, Joel F. Houston
Publisher: Cengage Learning
expand_more
expand_more
format_list_bulleted
Related questions
Question
None
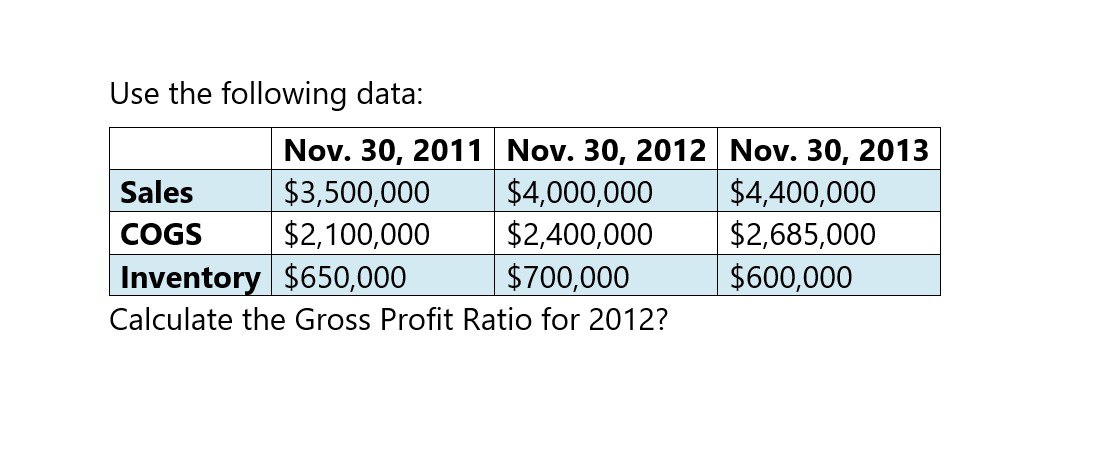

Transcribed Image Text:Use the following data:
Nov. 30, 2011
Nov. 30, 2012
Nov. 30, 2013
Sales
$3,500,000
$4,000,000
$4,400,000
COGS
$2,100,000
$2,400,000
$2,685,000
Inventory $650,000
$700,000
$600,000
Calculate the Gross Profit Ratio for 2012?
Expert Solution
This question has been solved!
Explore an expertly crafted, step-by-step solution for a thorough understanding of key concepts.

Step by stepSolved in 2 steps

Knowledge Booster

Similar questions
- What is the gross profit for 2012 ????arrow_forwardUse the following data: Nov. 30, 2011 Nov. 30, 2012 Nov. 30, 2013 Sales $ 35,00,000 $ 40,00,000 $ 44,00,000 COGS $ 21,00,000 $ 24,00,000 $ 26,85,000 Inventory $ 6,50,000 $ 7,00,000 $ 6,00,000 What is the Gross Profit for 2012?arrow_forwardsolve this onearrow_forward
- Use the following information for the Quick Studies below. (Algo) ($ thousands) Net sales Current Year $ 802,213 393,339 Prior Year $ 453,350 134,505 Cost of goods sold QS 13-7 (Algo) Trend percents LO P1 Determine the Prior Year and Current Year trend percents for net sales using the Prior Year as the base year. (Enter the answers in thousands of dollars.) Current Year: Prior Year: Numerator: Trend Percent for Net Sales: 1 1 1 Denominator: = = = Trend Percent 0% 0 %arrow_forwardRefer to the following mentioned data. Net sales Cost of products sold Gross margin (In millions) 2017 2016 $34,954 $30, 040 14,274 13, 395 $20, 680 $16, 645 2017 2016 2015 Required: a. Calculate the gross profit ratio for each of the past three years. (Round your answers to 2 decimal places.) 2015 $26, 091 13, 655 $12, 436 59.16 % 55.41 % 47.66 %arrow_forwardHi expert please help this questionarrow_forward
- Income Statement for Year Ended December 31, 2018 (Millions of Dollars) Net sales 795.0 Cost of goods sold 660.0 Gross profit 135.0 Selling expenses 73.5 EBITDA 61.5 Depreciation expenses 12.0 Earnings before interest and taxes (EBIT) 49.5 Interest expenses 4.5 Earnings before taxes (EBT) 45.0 Taxes (40%) 18.0 Net income 27.0 a. Calculate the ratios you think would be useful in this analysis. b. Construct a DuPont equation, and compare the companys ratios to the industry average ratios. c. Do the balance-sheet accounts or the income statement figures seem to be primarily responsible for the low profits? d. Which specific accounts seem to be most out of line relative to other firms in the industry? e. If the firm had a pronounced seasonal sales pattern or if it grew rapidly during the year, how might that affect the validity of your ratio analysis? How might you correct for such potential problems?arrow_forward! Required information Use the following information for the Quick Studies below. (Algo) ($ thousands) Net sales Current Year $ 803,470 394,775 Prior Year $ 455,095 135,878 Cost of goods sold QS 17-7 (Algo) Trend percents LO P1 Determine the Prior Year and Current Year trend percents for net sales using the Prior Year as the base year. (Enter the answers in thousands of dollars.) Current Year: Prior Year: Numerator: Trend Percent for Net Sales: 1 1 1 1 Denominator: = = = Trend Percent 0 % 0 %arrow_forwardNeed help with this general accounting questionarrow_forward
arrow_back_ios
SEE MORE QUESTIONS
arrow_forward_ios
Recommended textbooks for you
- Fundamentals of Financial Management (MindTap Cou...FinanceISBN:9781337395250Author:Eugene F. Brigham, Joel F. HoustonPublisher:Cengage Learning

 Intermediate Accounting: Reporting And AnalysisAccountingISBN:9781337788281Author:James M. Wahlen, Jefferson P. Jones, Donald PagachPublisher:Cengage Learning
  Managerial Accounting: The Cornerstone of Busines...AccountingISBN:9781337115773Author:Maryanne M. Mowen, Don R. Hansen, Dan L. HeitgerPublisher:Cengage Learning
Fundamentals of Financial Management (MindTap Cou...
Finance
ISBN:9781337395250
Author:Eugene F. Brigham, Joel F. Houston
Publisher:Cengage Learning
Intermediate Accounting: Reporting And Analysis
Accounting
ISBN:9781337788281
Author:James M. Wahlen, Jefferson P. Jones, Donald Pagach
Publisher:Cengage Learning
Managerial Accounting: The Cornerstone of Busines...
Accounting
ISBN:9781337115773
Author:Maryanne M. Mowen, Don R. Hansen, Dan L. Heitger
Publisher:Cengage Learning