Entrepreneurial Finance
6th Edition
ISBN: 9781337635653
Author: Leach
Publisher: Cengage
expand_more
expand_more
format_list_bulleted
Question
need help please provide correct answer as per requirement

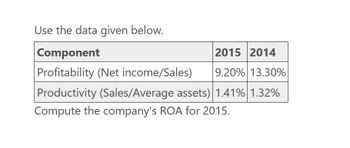
Transcribed Image Text:Use the data given below.
Component
Profitability (Net income/Sales)
2015 2014
9.20% 13.30%
Productivity (Sales/Average assets) 1.41% 1.32%
Compute the company's ROA for 2015.
Expert Solution
This question has been solved!
Explore an expertly crafted, step-by-step solution for a thorough understanding of key concepts.
Step by stepSolved in 2 steps

Knowledge Booster
Similar questions
- Need help this question general accountingarrow_forwardThe following revenue data were taken from the December 31, 2017, General Electric annual report (10-K): For each segment and each year, calculate intersegment sales (another name for transfer sales) as a percentage of total sales. Using Microsoft Excel or another spreadsheet application, create a clustered column graph to show the 2016 and 2017 percentages for each division. Comment on your observations of this data. How might a division sales manager use this data?arrow_forwardGIVE THE COMPARATIVE INCOME STATEMENT VERTICAL ANALYSIS FROM THE FOLLOWING INCOME STATEMENT BELOW JOLLIBEE INCOME STATEMENT ITEM 2016 2017 2018 2019 2020 Sales/Revenue 113.81B 133.61B 161.17B 179.63B 129.31B Sales Growth - 17.40% 20.62% 11.45% -28.01% Cost of Goods Sold (COGS) incl. D&A - - 132.96B 150.88B 115.39B COGS Growth - - - 13.47% -23.52% COGS excluding D&A 89.27B 105.39B 121.08B 137.38B 100.82B Depreciation & Amortization Expense 4B 4.75B 11.89B 13.5B 14.57B Depreciation 3.93B 4.66B 11.73B 13.34B 14.32B Amortization of Intangibles 68.99M 78.95M 151.82M 145.42M 245.23M Gross Income 20.54B 23.48B 28.21B 28.75B 13.92B Gross Income Growth - 14.30% 20.12% 1.93% -51.57% Gross Profit Margin - - - - 10.77% SG&A Expense - - 17.64B 20.21B 20.42B SGA Growth - - - 14.57% 1.02%…arrow_forward
- Use the following tables to answer the question: LOGIC COMPANY Income Statement For years ended December 31, 2016 and 2017 (values in $) 2016 2017 Gross sales 19,800 15,600 Sales returns and allowances 900 100 Net sales 18,900 15,500 COGS 11,800 8,800 Gross profit 7,100 6,700 Depreciation 780 640 Selling and administrative expenses 2,800 2,400 Research 630 540 Miscellaneous 440 340 Total operating expenses 4,650 3,920 Income before interest and taxes 2,450 2,780 Interest expense 640 540 Income before taxes 1,810 2,240 Provision for taxes 724 896 LOGIC COMPANY Balance Sheet For years ended December 31, 2016 and 2017 (values in $) 2016 2017 Current assets 12,300 9,400 Accounts receivable 16,900 12,900 Merchandise inventory 8,900 14,400 Prepaid expenses 24,400 10,400 Total current assets 62,500 47,100 Building (net) 14,900 11,400 Land 13,900 9,400 Total plant and equipment 28,800 20,800 Total assets 91,300 67,900 Accounts payable 13,400 7,400 Salaries payable 7,500 5,400 Total current…arrow_forwardRefer to the following mentioned data. Net sales Cost of products sold Gross margin 2017 2016 2015 Required: a. Calculate the gross profit ratio for each of the past three years. (Round your answers to 2 decimal places.) (In millions) 2016 2017 2015 $34,894 $30,411 $26,113 14,318 13,376 13,767 $20,576 $17,035 $12,346 Cost of goods sold Gross profit 58.94 % % % b. Assume that Campbell's net sales for the first four months of 2018 totaled $12.79 billion. Calculate an estimated cost of goods sold and gross profit for the four months, using the gross profit ratio for 2017. (Round Intermediate calculations to 2 decimal places. Enter your answers in millions rounded to nearest whole number (1.e., 5,000,000 should be entered as 5).) million millionarrow_forwardAssume the following this account question solutionarrow_forward
- Mac Donald company reported the following on its comparative income statement: 2017 2018 2019 Revenue 9,000 10,000 14,000 Cost of goods sold 6,000 4,000 9,000 Prepare a horizontal analysis of revenue , cost of goods sold and gross profitarrow_forward1. Data for Abakada Trading Company are given below: 2014 2015 Revenue 1,939,500 1,674,675 Cost of Goods Sold 900,000 843,975 Gross Profit 1,039,500 830,700 Selling and General Expenses 445,500 409,725 Other Expenses 37,575 30,825 Net Income 556,425 390,150 Requirements: a. Prepare a Vertical Analysis Statement A of Comprehensive Income for 2014 and 2015 for Abakada Trading Company. b. Prepare a horizontal analysis for Abakada Trading Company.arrow_forwardUse the following selected data from Success Systems' income statement for the three months ended March 31, 2014, and from its March 31, 2014, balance sheet to complete the requirements below: Computer services revenue $29,221 Net sales (of goods) $18,480 Total sales and revenue $47,701 Cost of goods sold $15,344 Net income $19,179 Quick assets $88,668 Current assets $96,904 Total assets $123,448 Current liabilities $970 Total liabilities $970 $122,478 Total equity Required: Compute the gross margin ratio (both with and without services revenue) and net profit margin ratio. (Round your answers to 1 decimal place.)arrow_forward
- Perform the following: a. horizontal analysis b. vertical analysis c. ratio analysis d. interpret the resultsarrow_forwardGiven the income statement for the MLC (Table 4–7) and balance sheet(Table 4–4), answer the following:a. Calculate the following ratios for 2012: operating profit margin, net profitmargin, operating return on assets, net return on assets, and return onequity.b. In a written explanation, describe what each ratio means.c. In a brief paragraph, describe the overall profitability of the MLC.arrow_forwardManero Company included the following information in its annual report: 2018 2017 Sales Cost of goods sold Operating expenses Net income $188,400 115,000 50,000 23,400 $162,500 102,500 50,000 10,000 2016 $150,500 100,000 45,000 5,500 In a common size income statement for 2017, the cost of goods sold are expressed as OA. 115.0% OB. 61.0% OC. 100.0% O D. 63.7%arrow_forward
arrow_back_ios
SEE MORE QUESTIONS
arrow_forward_ios
Recommended textbooks for you
- Principles of Accounting Volume 2AccountingISBN:9781947172609Author:OpenStaxPublisher:OpenStax College
 Managerial AccountingAccountingISBN:9781337912020Author:Carl Warren, Ph.d. Cma William B. TaylerPublisher:South-Western College Pub


Principles of Accounting Volume 2
Accounting
ISBN:9781947172609
Author:OpenStax
Publisher:OpenStax College

Managerial Accounting
Accounting
ISBN:9781337912020
Author:Carl Warren, Ph.d. Cma William B. Tayler
Publisher:South-Western College Pub