Related questions
Question
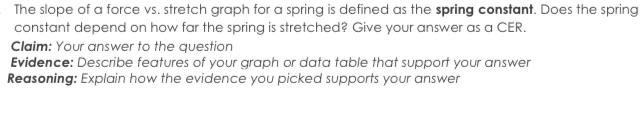

Transcribed Image Text:The slope of a force vs. stretch graph for a spring is defined as the spring constant. Does the spring
constant depend on how far the spring is stretched? Give your answer as a CER.
Claim: Your answer to the question
Evidence: Describe features of your graph or data table that support your answer
Reasoning: Explain how the evidence you picked supports your answer

Transcribed Image Text:4
10
15
20
Displacement (m)
6pring) 3
6.
2 N
5 lcm)
0-6 N
IN
.0.25N
10
7.2N
25N
0.SN
3.9 N
15
1.75N
3.5N
4.15 N
IN
5.7N
20
2.45N
7.5N
3.
い プ
(N) avo
Expert Solution
This question has been solved!
Explore an expertly crafted, step-by-step solution for a thorough understanding of key concepts.

This is a popular solution

Trending nowThis is a popular solution!

Step by stepSolved in 2 steps with 1 images

Knowledge Booster

Similar questions
- docs.google.com/forms * 'called the' of friction a- Calibration b- Coefficient c- Smoothness d- Description e- Fact In order to double the period of a simple pendulum, the length of the * string should be a) halved b) doubled c) quadrupled d) none of the mentioned What is the equation of the work onarrow_forwardSuppose the spring below has a spring constant of 50.0 N/m. The box has a mass of 8.0kg and rests on a surface of negligible friction. A. in the diagram above, the spring was ocmpressed 4.0 m. How much energy does the spring now store? B. Suppose that all of the elastic energy was transfered to the box when it was released. How fast would the box be moving?arrow_forwardA 0.8 Kg ball is released from rest from point A and it hits a spring at point B, as shown in the figure below. Spring constant is 310 N/m. Calculate change in the length of spring? (please type all steps of your solution and show the formulas you have used)arrow_forward
- 1) Using the result from Pre-Lab Question 2, calculate the coefficient of friction for each angle in Table 1 and Table 2. Find the average value for the coefficient of friction for wood and metal on cardboard. 2) Comment on your coefficients of static friction for wood and metal. If they are different, why do you think they are different? If they are the same, why do you think they are the same?arrow_forwardTwo equal forces , F, now pull on rod at the positions shown. Draw a FBD, Write 2nd Law equations and find the tension. Is the rod in STATIC EQUILIBRIUM? Explain If it moves describe the motionarrow_forwardQuestions: A group of students performed this lab and generated this graph of energy lost vs, distance. The group then repeats the lab, with a material with a smaller coefficient of friction. On the graph above, draw in RED a line that would be generated in this case. Explain your answer. Once again, they return to the original experiment but set the ramp at a smaller angle. On the graph above, draw in GREEN a line that would be generated in this case. Explain your answer. Can you also explain how a Energy Lost vs Distance Traveled graph gets coefficient of friction? Questions: A group of students performed this lab and generated this graph of energy lost vs. distance. 1. J Epargy Lost distance traveled (m) The group then repeats the lab, with a material with a smaller coefficient of friction. On the graph above, draw in RED a line that would be generated in this case. Explain your answer. 2. Once again, they return to the original experiment but the ramp at a smaller angle. On the…arrow_forward
arrow_back_ios
arrow_forward_ios