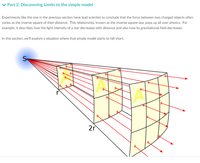
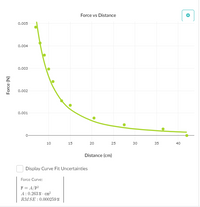
1) Return to your data table above and continue to collect data for those points for when the scale reading exceeds 0.002N.
Make a graph of force vs 1/(distance^2) and click the "linear regression" checkbox to fit the data to a line. Then deselect any force greater than 0.002 N so that it won't be included in the linear fit. You can deselect any point that you want to exclude from the fit simply by clicking on that point on the graph.
Does your new data match the trend established by the previous data? If not, do the new data points show a lower-than-expected or higher-than-expected force? Think of at least 4 tentative explanations as to why the data collected towards the end of the video would not show the same pattern as the data collected towards the beginning of the video.
| Distance (cm) | Force (N) | |
| 1 | 42 | 0 |
| 2 | 36.5 | 0.00029 |
| 3 | 27.5 | 0.00048 |
| 4 | 20.5 | 0.00078 |
| 5 | 15 | 0.00135 |
| 6 | 13 | 0.00155 |
| 7 | 11 | 0.00241 |
| 8 | 10 | 0.00297 |
| 9 | 9 | 0.00359 |
| 10 | 8 | 0.00413 |
| 11 | 7 | 0.00484 |


Trending nowThis is a popular solution!
Step by stepSolved in 2 steps

- A 68 kg lady is being hauled away from a flaming structure as shown in the figure. A 68 kg lady is being hauled away from a flaming structure as shown in the figure. Randomized Variables T T2 m = 68 kg 20° Calculate the tension in the first of the two ropes (in Newtons) if the lady is momentarily motionless. Calculate the tension in the second of the two ropes (in Newtons) if the lady is momentarily motionless.arrow_forwardDetermination of components of the forces in equilibrium.arrow_forwardNeeds Complete typed solution with 100 % accuracy.arrow_forward