1. Use graphing software to create a graph of Applied Force on the vertical axis versus displacement on the horizontal axis for the data collected when the spring constants for the top and bottom spring were both 200 N/m. 2. Add the data for the other two sets of spring constants to the same graph with trendlines for each data set. Include equations for the trendlines, a graph title, and axis titles with appropriate units. Experiment 1 Top Spring Constant=200 N/m, Bottom Spring Constant=200 N/m Data Table 1 Data Table 2 Graph 1 Data Table 3 Graph 2 Data Table 4 Graph 3 10.0 10.0 0.050 200 50 25.0 25.0 0.125 100 50.0 50.0 250 -50 25.0 25.0 -0.125 Top Spring Constant=200 N/m, Bottom Spring Constant = 500 N/m 20 -5.7 -14.3 0.029 top spring 200N/m, Bottom Spring = 500 N/m 50 -14.3 -35.7 0.071 100 -28.6 -71.4 143 -50 14.3 35.7 -0.071 Top Spring Constant 300 N/m, Bottom Spring Constant = 500 Nim 20 -7.5 -12.5 0.025 top spring 300N/m, Bottom Spring = 500 N/m 50 -18.8 31.3 0.063 100 -37.5 -62.5 0.125 18.7 31.2 -0.063 Exercise 1
1. Use graphing software to create a graph of Applied Force on the vertical axis versus displacement on the horizontal axis for the data collected when the spring constants for the top and bottom spring were both 200 N/m. 2. Add the data for the other two sets of spring constants to the same graph with trendlines for each data set. Include equations for the trendlines, a graph title, and axis titles with appropriate units. Experiment 1 Top Spring Constant=200 N/m, Bottom Spring Constant=200 N/m Data Table 1 Data Table 2 Graph 1 Data Table 3 Graph 2 Data Table 4 Graph 3 10.0 10.0 0.050 200 50 25.0 25.0 0.125 100 50.0 50.0 250 -50 25.0 25.0 -0.125 Top Spring Constant=200 N/m, Bottom Spring Constant = 500 N/m 20 -5.7 -14.3 0.029 top spring 200N/m, Bottom Spring = 500 N/m 50 -14.3 -35.7 0.071 100 -28.6 -71.4 143 -50 14.3 35.7 -0.071 Top Spring Constant 300 N/m, Bottom Spring Constant = 500 Nim 20 -7.5 -12.5 0.025 top spring 300N/m, Bottom Spring = 500 N/m 50 -18.8 31.3 0.063 100 -37.5 -62.5 0.125 18.7 31.2 -0.063 Exercise 1
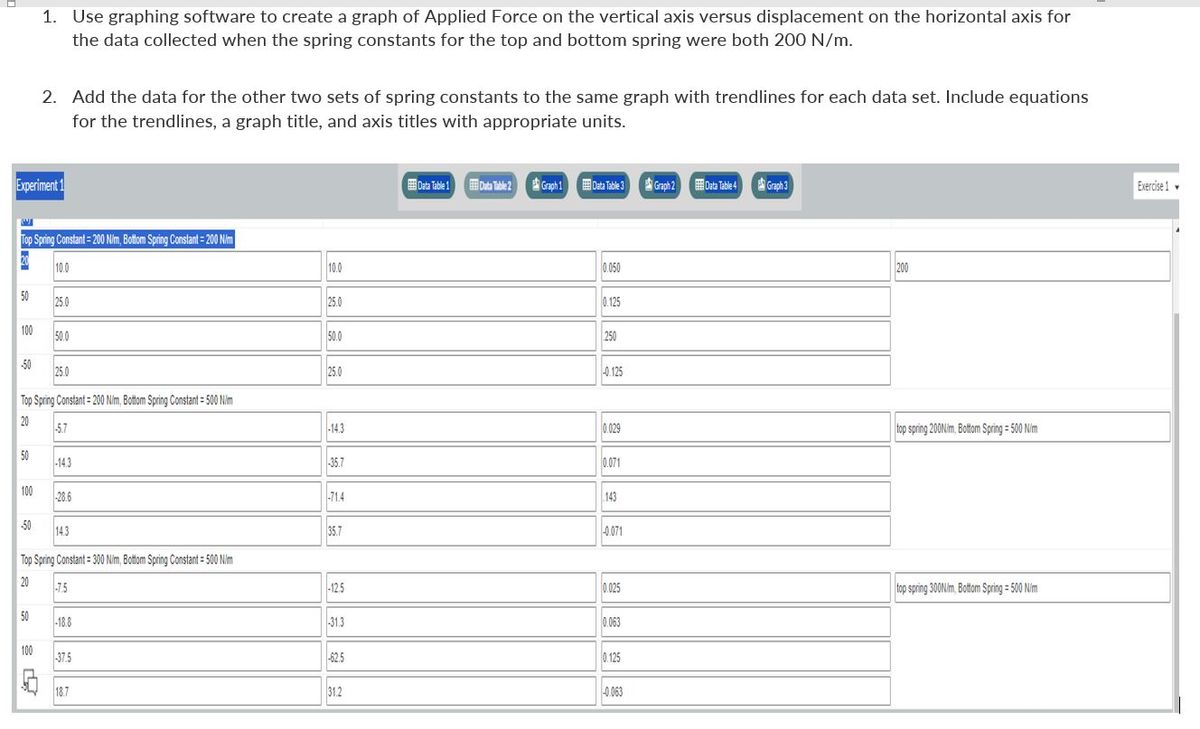
Transcribed Image Text:1. Use graphing software to create a graph of Applied Force on the vertical axis versus displacement on the horizontal axis for
the data collected when the spring constants for the top and bottom spring were both 200 N/m.
2. Add the data for the other two sets of spring constants to the same graph with trendlines for each data set. Include equations
for the trendlines, a graph title, and axis titles with appropriate units.
Experiment 1
Top Spring Constant=200 N/m, Bottom Spring Constant=200 N/m
Data Table 1 Data Table 2 Graph 1 Data Table 3 Graph 2
Data Table 4 Graph 3
10.0
10.0
0.050
200
50
25.0
25.0
0.125
100
50.0
50.0
250
-50
25.0
25.0
-0.125
Top Spring Constant=200 N/m, Bottom Spring Constant = 500 N/m
20
-5.7
-14.3
0.029
top spring 200N/m, Bottom Spring = 500 N/m
50
-14.3
-35.7
0.071
100
-28.6
-71.4
143
-50
14.3
35.7
-0.071
Top Spring Constant 300 N/m, Bottom Spring Constant = 500 Nim
20
-7.5
-12.5
0.025
top spring 300N/m, Bottom Spring = 500 N/m
50
-18.8
31.3
0.063
100
-37.5
-62.5
0.125
18.7
31.2
-0.063
Exercise 1
Expert Solution
This question has been solved!
Explore an expertly crafted, step-by-step solution for a thorough understanding of key concepts.


 University Physics (14th Edition)PhysicsISBN:9780133969290Author:Hugh D. Young, Roger A. FreedmanPublisher:PEARSON
 Introduction To Quantum MechanicsPhysicsISBN:9781107189638Author:Griffiths, David J., Schroeter, Darrell F.Publisher:Cambridge University Press
 Physics for Scientists and EngineersPhysicsISBN:9781337553278Author:Raymond A. Serway, John W. JewettPublisher:Cengage Learning
 Lecture- Tutorials for Introductory AstronomyPhysicsISBN:9780321820464Author:Edward E. Prather, Tim P. Slater, Jeff P. Adams, Gina BrissendenPublisher:Addison-Wesley
 College Physics: A Strategic Approach (4th Editio...PhysicsISBN:9780134609034Author:Randall D. Knight (Professor Emeritus), Brian Jones, Stuart FieldPublisher:PEARSON