ENGR.ECONOMIC ANALYSIS
14th Edition
ISBN: 9780190931919
Author: NEWNAN
Publisher: Oxford University Press
expand_more
expand_more
format_list_bulleted
Question

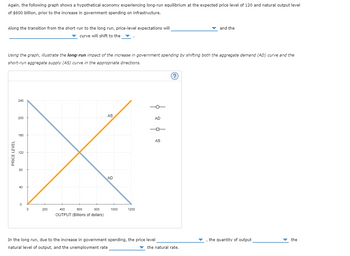
Transcribed Image Text:Again, the following graph shows a hypothetical economy experiencing long-run equilibrium at the expected price level of 120 and natural output level
of $600 billion, prior to the increase in government spending on infrastructure.
Along the transition from the short run to the long run, price-level expectations will
curve will shift to the Z.
Using the graph, illustrate the long-run impact of the increase in government spending by shifting both the aggregate demand (AD) curve and the
short-run aggregate supply (AS) curve in the appropriate directions.
PRICE LEVEL
240
200
160
120
80
40
0
0
200
400
600
800
OUTPUT (Billions of dollars)
AS
AD
1000
1200
| 2 | 2
In the long run, due to the increase in government spending, the price level
natural level of output, and the unemployment rate
(?
and the
▼ the natural rate.
the quantity of output
F
the

Transcribed Image Text:8. Economic fluctuations I
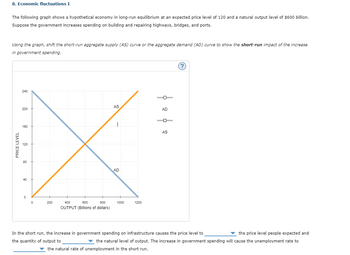
The following graph shows a hypothetical economy in long-run equilibrium at an expected price level of 120 and a natural output level of $600 billion.
Suppose the government increases spending on building and repairing highways, bridges, and ports.
Using the graph, shift the short-run aggregate supply (AS) curve or the aggregate demand (AD) curve to show the short-run impact of the increase
in government spending.
PRICE LEVEL
240
200
160
120
80
40
0
0
200
400
600
800
OUTPUT (Billions of dollars)
AS
I
AD
1000
1200
þ 2 6 2
AS
(?)
In the short run, the increase in government spending on infrastructure causes the price level to
the quantity of output to
the price level people expected and
▼ the natural level of output. The increase in government spending will cause the unemployment rate to
the natural rate of unemployment in the short run.
Expert Solution
This question has been solved!
Explore an expertly crafted, step-by-step solution for a thorough understanding of key concepts.
This is a popular solution
Trending nowThis is a popular solution!
Step by stepSolved in 3 steps with 2 images

Knowledge Booster
Learn more about
Need a deep-dive on the concept behind this application? Look no further. Learn more about this topic, economics and related others by exploring similar questions and additional content below.Similar questions
- 9arrow_forwardNow show the long-run impact of the increase in government spending by shifting both the aggregate demand (AD) curve and the short-run aggregate supply (AS) curve to the appropriate positions. 240 AS 200 AD 160 AS 120 AD 40 200 400 600 800 1000 1200 OUTPUT (Billions of dollars) In the long run, as a result of the increase in government spending, the price level the quantity of output the natural level of output, and the unemployment rate the natural rate of unemployment. PRICE LEVELarrow_forwardThe following graph shows the aggregate demand (AD) curve in a hypothetical economy. At point A, the price level is 140, and the quantity of output demanded is $300 billion. Moving down along the aggregate demand curve from point A to point B, the price level falls to 120, and the quantity of output demanded rises to $500 billion. 170 100 180 140 130 120 110 AD 100 00 100 200 300 400 B00 700 OUTPUT (Billians of dollars) As the price level falls, the cost of borrowing money will , causing the quantity of output demanded to Additionally, as the price level falls, the impact on the domestic interest rate will cause the real value of the dollar to in foreign exchange markets. The number of domestic products purchased by foreigners (exports) will therefore and the number of foreign products purchased by domestic consumers and firms (imports) will Net exports will therefore causing the quantity of domestic output demanded toarrow_forward
- The aggregate demand function: yad =C+1+G₁ = 500+ 0.75Y is plotted on the graph to the right. The graph also shows the 45° line where aggregate output Y equals aggregate demand yad for all points. What happens to aggregate output if government spending rises by 100? The equilibrium level of output rises by $ billion. (Round your response to the nearest billion.) Consumption Expenditure, C ($ billions) 3000- 2800- 2600- 2400- 2200- 2000- 1800- 1600- 1400- 1200- 1000- 800- 600- 400- 200- 0- 0 yad =C+I+G₁ = 500 +0.75Y Y = yad 45° 400 800 1200 1600 2000 2400 2800 Disposable Income ($ billions)arrow_forwardConsider the graph at right showing an economy in recession. Aggregate demand is currently at AD. Equilibrium currently occurs at Eo. If aggregate demand was ADF, there would be full employment. Suppose the government engages in fiscal policy that results in full crowding out. Using the line drawing tool, draw the new demand curve that shows full crowding out. Carefully follow the instructions above, and only draw the required object. Price level Eo EF ADO F Real GDP per Year ($ trillions) SRASO ADF O Uarrow_forwardH1.arrow_forward
- ? G The following graph shows a hypothetical economy in long-run equilibrium at an expected price level of 120 and a natural output level of $600 billion. Suppose the government increases spending on building and repairing highways, bridges, and ports. Using the graph, shift the short-run aggregate supply (AS) curve or the aggregate demand (AD) curve to show the short-run impact of the increase in government spending. PRICE LEVEL 240 200 AS 160 120 80 40 0 0 200 400 600 AD 800 1000 1200 OUTPUT (Billions of dollars) ŏ AD 一 AS (?) In the short run, the increase in government spending on infrastructure causes the price level to the quantity of output to the price level people expected and the natural level of output. The increase in government spending will cause the unemployment rate to the natural rate of unemployment in the short run. Again, the following graph shows a hypothetical economy experiencing long-run equilibrium at the expected price level of 120 and natural output level of…arrow_forwardThe following graph shows a hypothetical economy in long-run equilibrium at an expected price level of 120 and a natural output level of $300 billion. Suppose a stock market boom increases household wealth and causes consumers to spend more. Using the graph, shift the short-run aggregate supply (AS) curve or the aggregate demand (AD) curve to show the short-run impact of the stock market boom. PRICE LEVEL 3 AS 200 AD -α- 180 8 0 100 200 300 AD 400 500 600 OUTPUT (Billions of dollars) AS (?) In the short run, the increase in consumption spending associated with the stock market expansion causes the price level to level people expected and the quantity of output to the price the natural level of output. The stock market boom will cause the unemployment rate to ▼the natural rate of unemployment in the short run. Again, the following graph shows a hypothetical economy experiencing long-run equilibrium at the expected price level of 120 and natural output level of $300 billion, prior to the…arrow_forwardThe Greek letter a represents a number that determines how much output responds to unexpected changes in the price level. In this case, assume that a = $2 billion. That is, when the actual price level exceeds the expected price level by 1, the quantity of output supplied will exceed the natural level of output by $2 billion. Suppose the natural level of output is $50 billion of real GDP and that people expect a price level of 95. On the following graph, use the purple line (diamond symbol) to plot this economy's long-run aggregate supply (LRAS) curve. Then use the orange line segments (square symbol) to plot the economy's short-run aggregate supply (AS) curve at each of the following price levels: 85, 90, 95, 100, and 105. PRICE LEVEL 125 120 115 110 105 100 95 90 85 80 75 0 + 10 20 ¶¶ 30 40 50 60 70 OUTPUT (Billions of dollars) + 80 90 100 -O AS LRAS (?) The short-run quantity of output supplied by firms will rise above the natural level of output when the actual price level falls…arrow_forward
- Consider a hypothetical closed economy in which there are no income taxes. If households spend $0.75 of each additional dollar they earn and save the remainder, the expenditure multiplier for this economy is The following graph shows the initial aggregate demand (AD) and short-run aggregate supply (SRAS) curves of this economy. Suppose that the economy is currently in a recession. Business firms are pessimistic about the future and do not respond to a fall in interest rates. In addition, all households are pessimistic about job prospects and desire to consume less and save more at all levels of income. As a result, personal consumption in this economy decreases by $1 billion. The reduction in personal consumption will lead to a decrease in aggregate demand by S Shift either the AD curve or the SRAS curve, or both, to show the new aggregate demand curve after the full impact of the multiplier process of the reduction in personal consumption has taken place. PRICE LEVEL (Billions of…arrow_forwardFollowing an increase in consumer confidence, the US economy is experiencing a significant increase in aggregate spending. Using a correctly labeled aggregate demand and aggregate supply diagram, show how the change in aggregate spending will affect each of the following in the short run -Output -The price levelarrow_forwardWhich of the figures above illustrates an economy in long-run equilibrium? A) Figure A B) Figure B C) Figure Carrow_forward
arrow_back_ios
SEE MORE QUESTIONS
arrow_forward_ios
Recommended textbooks for you

 Principles of Economics (12th Edition)EconomicsISBN:9780134078779Author:Karl E. Case, Ray C. Fair, Sharon E. OsterPublisher:PEARSON
 Engineering Economy (17th Edition)EconomicsISBN:9780134870069Author:William G. Sullivan, Elin M. Wicks, C. Patrick KoellingPublisher:PEARSON
 Principles of Economics (MindTap Course List)EconomicsISBN:9781305585126Author:N. Gregory MankiwPublisher:Cengage Learning
 Managerial Economics: A Problem Solving ApproachEconomicsISBN:9781337106665Author:Luke M. Froeb, Brian T. McCann, Michael R. Ward, Mike ShorPublisher:Cengage Learning
 Managerial Economics & Business Strategy (Mcgraw-...EconomicsISBN:9781259290619Author:Michael Baye, Jeff PrincePublisher:McGraw-Hill Education


Principles of Economics (12th Edition)
Economics
ISBN:9780134078779
Author:Karl E. Case, Ray C. Fair, Sharon E. Oster
Publisher:PEARSON

Engineering Economy (17th Edition)
Economics
ISBN:9780134870069
Author:William G. Sullivan, Elin M. Wicks, C. Patrick Koelling
Publisher:PEARSON

Principles of Economics (MindTap Course List)
Economics
ISBN:9781305585126
Author:N. Gregory Mankiw
Publisher:Cengage Learning

Managerial Economics: A Problem Solving Approach
Economics
ISBN:9781337106665
Author:Luke M. Froeb, Brian T. McCann, Michael R. Ward, Mike Shor
Publisher:Cengage Learning

Managerial Economics & Business Strategy (Mcgraw-...
Economics
ISBN:9781259290619
Author:Michael Baye, Jeff Prince
Publisher:McGraw-Hill Education