
ENGR.ECONOMIC ANALYSIS
14th Edition
ISBN: 9780190931919
Author: NEWNAN
Publisher: Oxford University Press
expand_more
expand_more
format_list_bulleted
Related questions
Question
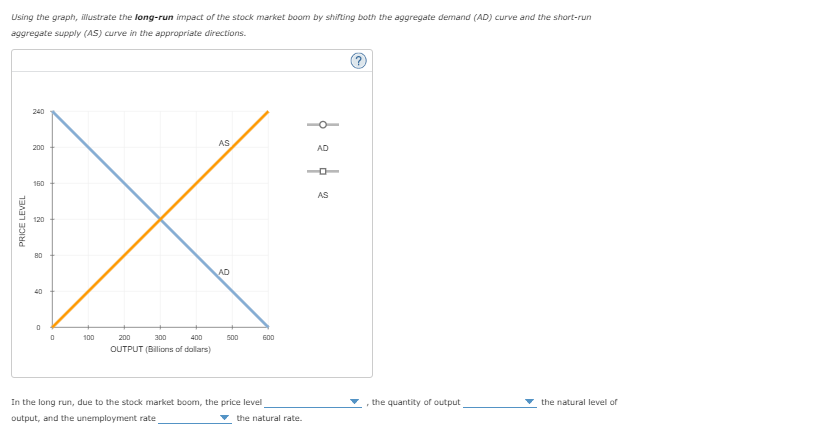

Transcribed Image Text:Using the graph, illustrate the long-run impact of the stock market boom by shifting both the aggregate demand (AD) curve and the short-run
aggregate supply (AS) curve in the appropriate directions.
PRICE LEVEL
240
200
160
120
80
40
0
100
200
300
400
OUTPUT (Billions of dollars)
AS
AD
500
600
In the long run, due to the stock market boom, the price level
output, and the unemployment rate
the natural rate.
0 2 0 2
, the quantity of output
the natural level of

Transcribed Image Text:The following graph shows a hypothetical economy in long-run equilibrium at an expected price level of 120 and a natural output level of $300 billion.
Suppose a stock market boom increases household wealth and causes consumers to spend more.
Using the graph, shift the short-run aggregate supply (AS) curve or the aggregate demand (AD) curve to show the short-run impact of the stock
market boom.
PRICE LEVEL
240
200
160
120
80
40
0
0
100
400
OUTPUT(Bilions of dollars)
200
300
AS
AD
500
600
AD
o
AS
(?
the price
In the short run, the increase in consumption spending associated with the stock market expansion causes the price level to
level people expected and the quantity of output to
the natural level of output. The stock market boom will cause the unemployment
rate to
the natural rate of unemployment in the short run.
Again, the following graph shows a hypothetical economy experiencing long-run equilibrium at the expected price level of 120 and natural output level
of $300 billion, prior to the increase in consumption spending associated with the stock market expansion.
Along the transition from the short run to the long run, price-level expectations will
curve will shift to the
and the
Expert Solution
This question has been solved!
Explore an expertly crafted, step-by-step solution for a thorough understanding of key concepts.

This is a popular solution

Trending nowThis is a popular solution!

Step by stepSolved in 3 steps with 2 images

Knowledge Booster


Learn more about
Need a deep-dive on the concept behind this application? Look no further. Learn more about this topic, economics and related others by exploring similar questions and additional content below.Similar questions
- Suppose the economy experiences a "supply shock" due to a fall in oil prices. As a result, the economy experiences a/an ___________in the price level and a/an _______in the level of output(GDP) Group of answer choices Decrease; decrease Increase; increase Decrease; increase Increase; decreasarrow_forwardor False: The economy is currently in short-run equilibrium.arrow_forwardP 100, B LRAS A 40 A 14 -SRAS₁ SRAS₂ SRAS3 AD Y Y In the graph above, assume that the economy is currently in point E. In this situation, if the government does not take any policy measures to bring the economy to the fill-employment level of output, the economy will move toward point in the long run. a. C b. A c. D d. E (Continue to use the above graph) Again, assume that the economy is currently in point E. Now, the Fed wants to stabilize the output (that is, maintain the output at the full-employment level) by conducting monetary policy. Then the new equilibrium output will be at a. A c. C b. B d. D e. Earrow_forward
- 8. Economic fluctuations I The following graph shows a hypothetical economy in long-run equilibrium at an expected price level of 120 and a natural output level of $300 billion. Suppose households suddenly begin to spend less and save more in order to increase saving for retirement. Using the graph, shift the short-run aggregate supply (AS) curve or the aggregate demand (AD) curve to show the short-run impact of the sharp increase in saving. PRICE LEVEL 240 200 160 120 8 40 100 200 300 400 OUTPUT (Billions of dollars) AS AD 500 600 AD AS ? In the short run, the decrease in consumption spending associated with the increase in saving causes the price level to people expected and the quantity of output to rate to the natural rate of unemployment in the short run. the price level the natural level of output. The sharp increase in saving will cause the unemploymentarrow_forwardThe graphs illustrate an initial equilibrium for some economy. Suppose that the economy experiences a rise in aggregate demand. Use the graphs to illustrate the new positions of AD, SRAS, and LRAS as well as the new short-run and long-run equilibria resulting from this change. Short-Run Graph Long-Run Graph LRAS LRAS SRAS SRAS Equilibrium point Equilibrium point AD AD Real GDP Real GDP Aggregate price level Aggregate price levelarrow_forward5. AD; SRAS; LRAS; Short-run equilibrium; Long-run equilibrium; Recessionary gap and Inflationary gap. Consider diagram below to answer the following questions: LRAS SRAS `AD1 Q1 Real GDP (a) – Use Point 1 and Point 2 to explain the difference between the short-run equilibrium and the long-run equilibrium. (b) - The economy is currently producing Qi. At this level of Real GDP, the economy is in a(n)_ . (recessionary gap or inflationary gap). Select one. (c) - The unemployment rate is lower at than - (Q:/QN, QN/ Q1). Select one. (d) – At QN, cyclical unemployment (Uc) is (positive, negative, zero). Select one. Price Levelarrow_forward
- Economic fluctuations I The following graph shows the economy in long-run equilibrium at the expected price level of 120 and the natural level of output of $600 billion. Suppose firms become pessimistic about future business conditions and cut back on investment spending. Shift the short-run aggregate supply (AS) curve or the aggregate demand (AD) curve to show the short-run impact of the business pessimism. ADAS02004006008001000120024020016012080400PRICE LEVELOUTPUT (Billions of dollars)AD1 AD2 AS In the short run, the decrease in investment spending associated with business pessimism causes the price level torise above the price level people expected and the quantity of output torise above the natural level of output. The business pessimism will cause the unemployment rate tofall below the natural rate of unemployment in the short run. Again, the following graph shows the economy in long-run equilibrium at the expected price level of 120 and the…arrow_forwardComplete the following table by matching the macroeconomic assumptions about aggregate supply to the appropriate school of thought. Assumption Classical Keynesian Only an increase in aggregate demand can move an economy out of a recession and back to potential real GDP quickly. Product prices and wages tend to be inflexible. The following graph shows the aggregate demand (ADAD) and aggregate supply (ASAS) curves for a hypothetical economy that is currently operating below its full-employment output level. That is, the economy is currently in a recession. The aggregate supply curve (ASAS) in this diagram is consistent with the view of aggregate supply. According to this viewpoint, the government should spending in response to the recession. Shift the appropriate curve on the graph to illustrate the impact of this change in government spending. ADASPRICE LEVELREAL GDP (Trillions of dollars)AD AS The prescribed…arrow_forwardA technological improvement raises productivity. On the following graph indicate the short run and long run effects of this change on the economy, assuming policymakers take no action. In the short run, the price level blanks and output blank. In the long run, the price level will be blank and output will be blank compared to the initial equilibrium prior to the changearrow_forward
- On the following graph, use the black point (cross symbol) to show the short-run equilibrium. Then use the grey point (star symbol) to show the long- run equilibrium. PRICE LEVEL 120 110 100 1 LRAS REAL GOP In the short run, the price level is Natural Real GDP SRAS, SRAS, AD SRAS, AD AD₂ and Real GDP is ++ Short-Run Equilibrium ✡ Long-Run Equilibrium ? Natural Real GDP. In the long run, the price level is and Real GDP is Aarrow_forwardThe Greek letter a represents a number that determines how much output responds to unexpected changes in the price level. In this case, assume that a = $2 billion. That is, when the actual price level exceeds the expected price level by 1, the quantity of output supplied will exceed the natural level of output by $2 billion. Suppose the natural level of output is $50 billion of real GDP and that people expect a price level of 95. On the following graph, use the purple line (diamond symbol) to plot this economy's long-run aggregate supply (LRAS) curve. Then use the orange line segments (square symbol) to plot the economy's short-run aggregate supply (AS) curve at each of the following price levels: 85, 90, 95, 100, and 105. PRICE LEVEL 125 120 115 110 105 100 95 90 85 80 75 0 + 10 20 ¶¶ 30 40 50 60 70 OUTPUT (Billions of dollars) + 80 90 100 -O AS LRAS (?) The short-run quantity of output supplied by firms will rise above the natural level of output when the actual price level falls…arrow_forwardWhich of the figures above illustrates an economy in long-run equilibrium? A) Figure A B) Figure B C) Figure Carrow_forward
arrow_back_ios
SEE MORE QUESTIONS
arrow_forward_ios
Recommended textbooks for you
 Principles of Economics (12th Edition)EconomicsISBN:9780134078779Author:Karl E. Case, Ray C. Fair, Sharon E. OsterPublisher:PEARSON
 Engineering Economy (17th Edition)EconomicsISBN:9780134870069Author:William G. Sullivan, Elin M. Wicks, C. Patrick KoellingPublisher:PEARSON
 Principles of Economics (MindTap Course List)EconomicsISBN:9781305585126Author:N. Gregory MankiwPublisher:Cengage Learning
 Managerial Economics: A Problem Solving ApproachEconomicsISBN:9781337106665Author:Luke M. Froeb, Brian T. McCann, Michael R. Ward, Mike ShorPublisher:Cengage Learning
 Managerial Economics & Business Strategy (Mcgraw-...EconomicsISBN:9781259290619Author:Michael Baye, Jeff PrincePublisher:McGraw-Hill Education
Principles of Economics (12th Edition)
Economics
ISBN:9780134078779
Author:Karl E. Case, Ray C. Fair, Sharon E. Oster
Publisher:PEARSON
Engineering Economy (17th Edition)
Economics
ISBN:9780134870069
Author:William G. Sullivan, Elin M. Wicks, C. Patrick Koelling
Publisher:PEARSON
Principles of Economics (MindTap Course List)
Economics
ISBN:9781305585126
Author:N. Gregory Mankiw
Publisher:Cengage Learning
Managerial Economics: A Problem Solving Approach
Economics
ISBN:9781337106665
Author:Luke M. Froeb, Brian T. McCann, Michael R. Ward, Mike Shor
Publisher:Cengage Learning
Managerial Economics & Business Strategy (Mcgraw-...
Economics
ISBN:9781259290619
Author:Michael Baye, Jeff Prince
Publisher:McGraw-Hill Education