
MATLAB: An Introduction with Applications
6th Edition
ISBN: 9781119256830
Author: Amos Gilat
Publisher: John Wiley & Sons Inc
expand_more
expand_more
format_list_bulleted
Related questions
Concept explainers
Topic Video
Question
thumb_up100%
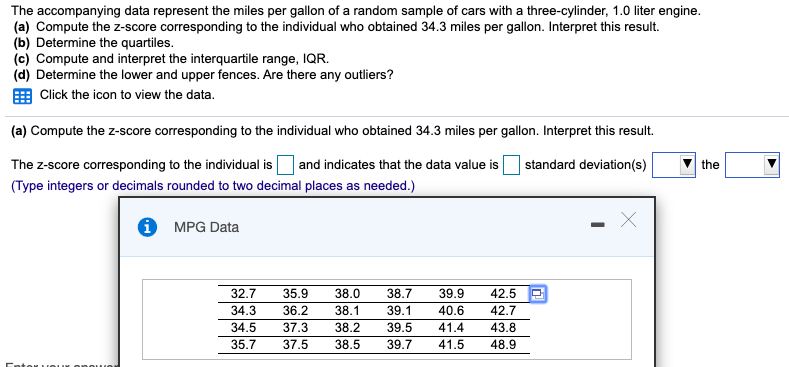

Transcribed Image Text:The accompanying data represent the miles per gallon of a random sample of cars with a three-cylinder, 1.0 liter engine.
(a) Compute the z-score corresponding to the individual who obtained 34.3 miles per gallon. Interpret this result.
(b) Determine the quartiles.
(c) Compute and interpret the interquartile range, IQR.
(d) Determine the lower and upper fences. Are there any outliers?
Click the icon to view the data.
(a) Compute the z-score corresponding to the individual who obtained 34.3 miles per gallon. Interpret this result.
The z-score corresponding to the individual is O and indicates that the data value is standard deviation(s)
(Type integers or decimals rounded to two decimal places as needed.)
the
O MPG Data
38.0
42.5
42.7
32.7
35.9
38.7
39.1
39.5
39.9
34.3
36.2
38.1
40.6
34.5
37.3
38.2
41.4
43.8
35.7
37.5
38.5
39.7
41.5
48.9
Expert Solution
This question has been solved!
Explore an expertly crafted, step-by-step solution for a thorough understanding of key concepts.

This is a popular solution

Trending nowThis is a popular solution!

Step by stepSolved in 2 steps with 2 images

Knowledge Booster


Learn more about
Need a deep-dive on the concept behind this application? Look no further. Learn more about this topic, statistics and related others by exploring similar questions and additional content below.Similar questions
- Several years ago, the state of California launched an aggressively advertisement campaign against smoking. We've interviewed students from 16 college campuses in California and recorded for each campus the percentage of students who claimed that they had encountered assay least one anti smoking advertisement on campus in the past month. Here are those percentages. 53 39 30 49 48 42 41 38 26 36 40 42 52 51 45 50 Construct a box and whisker plot for the data.arrow_forwardPress Esc to exit full screen Class Вoys Girls Ms.Rangel 10 6. Ms.Isais 7 Mr.Gomez 8 8 Mr.Hernandez 11 5 Find: Mean Median Mode Rangearrow_forwardAre cigarettes bad for people? Cigarette smoking involves tar, carbon monoxide, and nicotine (measured in milligrams). The first two are definitely not good for a person's health, and the last ingredient can cause addiction. Use the data in the table above to make a stem-and-leaf display for milligrams of tar per cigarette smoked. (Enter NONE in any unused answer blanks.) Are there any outliers? A. Yes, 1.0 may be an outlier. B. No, there are no outliers. C. Yes, 29.8 may be an outlier.arrow_forward
- The midterm exam grades of an engineering course were used to create the following stem and leaf plot. What is the third quartile of these scores? A. 52 | Stem-and-leaf of grades N = 40 Leaf Unit = 1.0 B. 73 C. 86 25 D. 93 4 5 26 6. 1359 7 00338 8 01122335789 9 00111233445677899arrow_forwardryan has collected data on individual income (reported in dollars) and has not found any outliers. ryan wants to calculate the average income in his data. which measure of central tendency should he use? -mean -variance -mode -medianarrow_forwardSee photo for question/problem.arrow_forward
- A large, multi-company construction workers union is gathering data on the number of workplace injuries that occurred last year. It gathers the number of injuries from 20 randomly selected companies among the hundreds of construction companies at which its members work. The data are provided below. Use Excel and the QUARTILE.INC function to construct a box and whisker plot for the dataset. What is the value of the median? Round your answer to one decimal place. Number of on the job injuries 133333220324312076417 109328 30arrow_forwardBecause the mean is very sensitive to extreme values, it is not a resistant measure of center. By deleting some low values and high values, the trimmed mean is more resistant. To find the 10% trimmed mean for a data set, first arrange the data in order, then delete the bottom 10% of the values and delete the top 10% of the values, then calculate the mean of the remaining values. Use axial loads (pounds) of aluminum cans listed below for cans that are 0.0111 in. thick. Identify any outliers, then compare the median, mean, 10% trimmed mean, and 20% trimmed mean. 247 261 269 273 275 280 282 282 284 285 285 287 290 292 293 296 296 299 311 507 Identify any outliers. Select the correct choice below and, if necessary, fill in the answer box to complete your choice. OA. The outlier(s) is/are pounds. (Type a whole number. Use a comma to separate answers as needed.) C OB. There are no outliers.arrow_forwardConstruct a box plot of a data set with a median of 50, a minimum value of 20, first quartile 42, IQR=29, and a maximum value of 90. What percentage of total data is between 42 and 71?arrow_forward
arrow_back_ios
arrow_forward_ios
Recommended textbooks for you
- MATLAB: An Introduction with ApplicationsStatisticsISBN:9781119256830Author:Amos GilatPublisher:John Wiley & Sons Inc
 Probability and Statistics for Engineering and th...StatisticsISBN:9781305251809Author:Jay L. DevorePublisher:Cengage Learning
 Statistics for The Behavioral Sciences (MindTap C...StatisticsISBN:9781305504912Author:Frederick J Gravetter, Larry B. WallnauPublisher:Cengage Learning
  Elementary Statistics: Picturing the World (7th E...StatisticsISBN:9780134683416Author:Ron Larson, Betsy FarberPublisher:PEARSON
 The Basic Practice of StatisticsStatisticsISBN:9781319042578Author:David S. Moore, William I. Notz, Michael A. FlignerPublisher:W. H. Freeman
 Introduction to the Practice of StatisticsStatisticsISBN:9781319013387Author:David S. Moore, George P. McCabe, Bruce A. CraigPublisher:W. H. Freeman
MATLAB: An Introduction with Applications
Statistics
ISBN:9781119256830
Author:Amos Gilat
Publisher:John Wiley & Sons Inc
Probability and Statistics for Engineering and th...
Statistics
ISBN:9781305251809
Author:Jay L. Devore
Publisher:Cengage Learning
Statistics for The Behavioral Sciences (MindTap C...
Statistics
ISBN:9781305504912
Author:Frederick J Gravetter, Larry B. Wallnau
Publisher:Cengage Learning
Elementary Statistics: Picturing the World (7th E...
Statistics
ISBN:9780134683416
Author:Ron Larson, Betsy Farber
Publisher:PEARSON
The Basic Practice of Statistics
Statistics
ISBN:9781319042578
Author:David S. Moore, William I. Notz, Michael A. Fligner
Publisher:W. H. Freeman
Introduction to the Practice of Statistics
Statistics
ISBN:9781319013387
Author:David S. Moore, George P. McCabe, Bruce A. Craig
Publisher:W. H. Freeman