A First Course in Probability (10th Edition)
10th Edition
ISBN: 9780134753119
Author: Sheldon Ross
Publisher: PEARSON
expand_more
expand_more
format_list_bulleted
Question

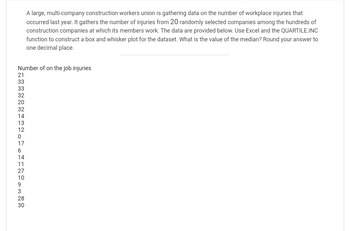
Transcribed Image Text:A large, multi-company construction workers union is gathering data on the number of workplace injuries that
occurred last year. It gathers the number of injuries from 20 randomly selected companies among the hundreds of
construction companies at which its members work. The data are provided below. Use Excel and the QUARTILE.INC
function to construct a box and whisker plot for the dataset. What is the value of the median? Round your answer to
one decimal place.
Number of on the job injuries
133333220324312076417 109328 30
Expert Solution
This question has been solved!
Explore an expertly crafted, step-by-step solution for a thorough understanding of key concepts.
This is a popular solution
Trending nowThis is a popular solution!
Step by stepSolved in 4 steps with 3 images

Knowledge Booster
Similar questions
- The picture for the dataset for AIDS cases below include the numbers of cases of AIDS in Australia by date of diagnosis for successive 3-month periods from 1984 to 1988. (Data from National Centre for HIV Epidemiology and Clinical Research, 1994.) Please answer all parts a, b, and c of this question. Show all work. a) Perform an EDA to inspect, understand and describe the information collected in this dataset. Use appropriate summary statistics and plots to present your results from the EDA. b) What is your conclusion about AIDS incidence in Australia during this time period? c) Suggest two probability distributions which could be good candidates for fitting the number of cases in this study. Which probability distribution would you prefer to fit the data in this particular example? Why?arrow_forwardUse the coefficient of variation to determine whether coffee prices or gasoline prices were more stable in 2015. Use the population standard and population mean of each set of data. What is the coefficient of variation for the price of a pound of coffee and a pound of gasoline?arrow_forwardExplain what a box and whisker plot is and how we use it to understand central tendency and variability.arrow_forward
- Number of Frogs Caught Daily Next to my House 29 23 14 13 23 22 16 24 27 25 26 19 21 19 25 what's the mode of the data set?arrow_forwardThe following set of data represents the number of orders filled by a national-chain restaurant during a two week period. Construct a five number summary for the the data. 66, 75, 68, 89, 86, 73, 67, 75, 75, 82, 85, 74, 67, 61 (Round to the nearest hundredth, if needed). Min _________________ Lower Quartile _________________ Median __________________ Upper Quartile _________________ Maximum __________________ What is the range and the interquartile range (IQR)? Range __________________ Interquartile Range (IQR) ___________________arrow_forwardSeveral years ago, the state of California launched an aggressively advertisement campaign against smoking. We've interviewed students from 16 college campuses in California and recorded for each campus the percentage of students who claimed that they had encountered assay least one anti smoking advertisement on campus in the past month. Here are those percentages. 53 39 30 49 48 42 41 38 26 36 40 42 52 51 45 50 Construct a box and whisker plot for the data.arrow_forward
- The durations (minutes) of 26 electric power outages in the community of Sonando Heights overthe past five years are shown below. (a) Find the mean, median, and mode. (b) Are the mean andmedian about the same? (c) Is the mode a good measure of center for this data set? Explain. (d) Isthe distribution skewed? Explain. 32 44 25 66 27 12 62 9 51 4 17 50 3599 30 21 12 53 25 2 18 24 84 30 17 17arrow_forwardDraw the box-and-whisker plot and give the five-number summary for each data set. Number of games won by the Detroit Lions in their last 10 seasons: minumim:________ (9,7,11,7,4,10,6,2,0,7) Lower Quartile:________ Median:______________ Upper Quartile:_____________ Maximum_______________arrow_forwardfind population variance for given data 15,85,96,75,46,35,21,56,54,47arrow_forward
- Consider the data set given by, (11, 17, 18, 23, 25, 26, 26, 31, 31, 33, 41, 44, 45, 48, 53) Find the lower (first) quartile median upper (third) quartile mean. round to one decimal place. mode(s)arrow_forwardA County Board of Supervisors has appointed an urban planning committee to evaluate proposed community development projects. The committee is analyzing, among other things, data on household incomes in two cities within the county. They have collected data on the income of 77 households in each of the two cities. The histograms below show the distributions of the two sets of incomes (in thousands of dollars). Each histogram shows household income on the horizontal axis and number of households on the vertical axis. The means and standard deviations for the data sets are also given. City A City B 25+ 20+ 15+ 10+ 5- ← 10 20 30 40 50 60 70 80 90 100 City A mean: 73.96 thousand dollars City A standard deviation: 20.30 thousand dollars Explanation 25- 20- 15- 104 5+ 10 (a) Identify the data set for which it is appropriate to use the Empirical Rule. It is appropriate to use the Empirical Rule for the (Choose one) ▼ data set. 20 30 The committee wants to use the Empirical Rule to make some…arrow_forwardWhy Mode value is one of the given set of data values?arrow_forward
arrow_back_ios
SEE MORE QUESTIONS
arrow_forward_ios
Recommended textbooks for you
 A First Course in Probability (10th Edition)ProbabilityISBN:9780134753119Author:Sheldon RossPublisher:PEARSON

A First Course in Probability (10th Edition)
Probability
ISBN:9780134753119
Author:Sheldon Ross
Publisher:PEARSON
