MATLAB: An Introduction with Applications
6th Edition
ISBN: 9781119256830
Author: Amos Gilat
Publisher: John Wiley & Sons Inc
expand_more
expand_more
format_list_bulleted
Question
thumb_up100%

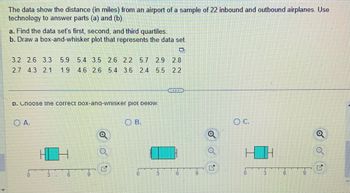
Transcribed Image Text:The data show the distance (in miles) from an airport of a sample of 22 inbound and outbound airplanes. Use
technology to answer parts (a) and (b).
a. Find the data set's first, second, and third quartiles.
b. Draw a box-and-whisker plot that represents the data set.
O
3.2 2.6 3.3 5.9 5.4 3.5 2.6 2.2 5.7 2.9 2.8
2.7 4.3 2.1 1.9 4.6 2.6 5.4 3.6 2.4 5.5
2.2
D. Choose the correct box-ana-wnisker plot below.
O A.
6
e
OB.
0
22
....
16
O C.
3
6
o

Transcribed Image Text:=
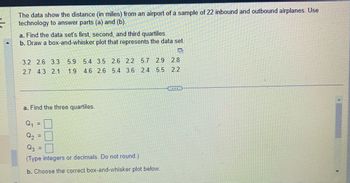
The data show the distance (in miles) from an airport of a sample of 22 inbound and outbound airplanes. Use
technology to answer parts (a) and (b).
a. Find the data set's first, second, and third quartiles.
b. Draw a box-and-whisker plot that represents the data set.
D
3.2 2.6 3.3 5.9 5.4 3.5 2.6 2.2 5.7 2.9
2.8
2.7 4.3 2.1 1.9 4.6 2.6 5.4 3.6 2.4 5.5 2.2
a. Find the three quartiles.
Q₁
Q₂
d
(Type integers or decimals. Do not round.)
b. Choose the correct box-and-whisker plot below.
Expert Solution
arrow_forward
Step 1
Given
Arranging Observations in the ascending order, We get :
1.9,2.1,2.2,2.2,2.4,2.6,2.6,2.6,2.7,2.8,2.9,3.2,3.3,3.5,3.6,4.3,4.6,5.4,5.4,5.5,5.7,5.9
Step by stepSolved in 3 steps with 2 images

Knowledge Booster
Similar questions
- 0 | 4 5 1 | 2 4 8 9 2 | 1 3 6 6 9 9 9 3 | 0 1 2 4 7 7 7 8 9 4 | 1 2 3 4 6 5 | 4 Key:3 | 0=30 The weights, in pounds, of packages on a delivery truck are shown in the stem-and-leaf plot. Find the mean, median, and the mode of the data, If possible. If any measure cannot be found or does not represent the center of the data, explain why. Does the mean represent the center of the data? Does the median represent the center of the data? Does (do) the mode(s) represent a typical entry of the data?arrow_forwardGiven the following set of data, determine the mode.arrow_forwardThe data show the distance (in miles) from an airport of a sample of 22 inbound and outbound airplanes. Use technology to answer parts (a) and (b). a. Find the data set's first, second, and third quartiles. b. Draw a box-and-whisker plot that represents the data set. 5.2 4.1 2.6 5.8 4.9 5.4 4.1 2.5 5.2 5.5 2.3 2.2 2.6 1.9 3.1 4.5 5.2 5.9 4.9 4.6 2.4 3.4 a. Find the three quartiles. Q₁ = Q₂ = Q3 (Type integers or decimals. Do not round.) ||arrow_forward
- Use the given data to complete parts (a) and (b) below. 薑 y 2.2 3.8 4 1.5 2.9 3.7 4.6 4.9 (a) Draw a scatter diagram of the data. Choose the correct answer below. OA. B. OD. AY 6- Ay 6- 6- Ay 64 4- 4- 4- 4- 2- 2- 2- 2- 0- 0- 0- 4 Compute the linear correlation coefficient. The linear correlation coefficient for the four pieces of data is (Round to three decimal places as needed.)arrow_forwardConsider the following box and whisker plot. Find the indicated values of the represented data. 16 38 64 78 90 18 28 30 48 50 60 78 80 98 100 Third quartile Maximum.arrow_forwardUse a scatter plot to display the data shown in the table below. The data represents the number of students per teacher and the average teacher salaries (in thousands of dollars) in 10 school districts. Number of Students per Teacher Average Teacher's Salary 17.2 28.6 17.8 46.6 18.2 32.1 17.4 27.6 18.4 39.8 17.6 32.8 15.0 49.5 17.5 38.4 13.7 42.1 18.0 32.4 1.Construct a scatter diagram. 2.Describe the relation between students per teacher and average teacher salary. A. As the amount of students per teacher increases, the average teacher salary also increases. B. As the amount of students per teacher decreases, the average teacher salary increases. C. There appears to be no relation between students per teacher and average teacher salary.arrow_forward
- Find mean, median, Q1 and Q3 for the following data. Determine whether there are outliers. Construct a box plot to represent this data. 2. 1 6 3. 2 4 5. 6 7 8 6. 0 0 2 2 2 8 9 7. 0 0 0 1 4 5 5 8 2 8. 1 2 2 6 8 8 9. 2 2 4 5 8 8arrow_forwardFind the five-number summary for the following data set. 8 2 8 8 7 5 8 6 4 1 Min Q1 Median Q3 Maxarrow_forwardWhich is the correct box-and-whisker plot for the following data: 1, 6, 8, 10, 18, 30, 50 6. 30 1 10 50 24 10 50 8. 8 18 1 10 50 7 14 50 19arrow_forward
- Part a. Find the data set's first, second, and third quartiles. Part b. Draw a box and whisker plot that represents the data setarrow_forwardMembers of the student council are seling bagels during each class period of the school day for a fundrasier. Yu-na made a scatter plot to see if there was a relationship between the class period and the number of bagels sold.Yu-na draws a line of best fit. Which of these lines is the best model for the data?arrow_forwardwhich box plot best represents this data?arrow_forward
arrow_back_ios
SEE MORE QUESTIONS
arrow_forward_ios
Recommended textbooks for you
 MATLAB: An Introduction with ApplicationsStatisticsISBN:9781119256830Author:Amos GilatPublisher:John Wiley & Sons Inc
 Probability and Statistics for Engineering and th...StatisticsISBN:9781305251809Author:Jay L. DevorePublisher:Cengage Learning
 Statistics for The Behavioral Sciences (MindTap C...StatisticsISBN:9781305504912Author:Frederick J Gravetter, Larry B. WallnauPublisher:Cengage Learning
 Elementary Statistics: Picturing the World (7th E...StatisticsISBN:9780134683416Author:Ron Larson, Betsy FarberPublisher:PEARSON
 The Basic Practice of StatisticsStatisticsISBN:9781319042578Author:David S. Moore, William I. Notz, Michael A. FlignerPublisher:W. H. Freeman
 Introduction to the Practice of StatisticsStatisticsISBN:9781319013387Author:David S. Moore, George P. McCabe, Bruce A. CraigPublisher:W. H. Freeman

MATLAB: An Introduction with Applications
Statistics
ISBN:9781119256830
Author:Amos Gilat
Publisher:John Wiley & Sons Inc

Probability and Statistics for Engineering and th...
Statistics
ISBN:9781305251809
Author:Jay L. Devore
Publisher:Cengage Learning

Statistics for The Behavioral Sciences (MindTap C...
Statistics
ISBN:9781305504912
Author:Frederick J Gravetter, Larry B. Wallnau
Publisher:Cengage Learning

Elementary Statistics: Picturing the World (7th E...
Statistics
ISBN:9780134683416
Author:Ron Larson, Betsy Farber
Publisher:PEARSON

The Basic Practice of Statistics
Statistics
ISBN:9781319042578
Author:David S. Moore, William I. Notz, Michael A. Fligner
Publisher:W. H. Freeman

Introduction to the Practice of Statistics
Statistics
ISBN:9781319013387
Author:David S. Moore, George P. McCabe, Bruce A. Craig
Publisher:W. H. Freeman