MATLAB: An Introduction with Applications
6th Edition
ISBN: 9781119256830
Author: Amos Gilat
Publisher: John Wiley & Sons Inc
expand_more
expand_more
format_list_bulleted
Concept explainers
Topic Video
Question

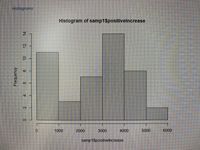
Transcribed Image Text:Histograms
Histogram of samp1$positivelncrease
2.
1000
2000
3000
4000
5000
6000
samp1$positivelncrease
14
12.
10.
8.
6.
4.
Frequency

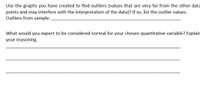
Transcribed Image Text:Use the graphs you have created to find outliers (values that are very far from the other data
points and may interfere with the interpretation of the data)? If so, list the outlier values.
Outliers from sample:
What would you expect to be considered normal for your chosen quantitative variable? Explain
your reasoning.
Expert Solution
This question has been solved!
Explore an expertly crafted, step-by-step solution for a thorough understanding of key concepts.
Step by stepSolved in 2 steps

Knowledge Booster
Learn more about
Need a deep-dive on the concept behind this application? Look no further. Learn more about this topic, statistics and related others by exploring similar questions and additional content below.Similar questions
- Examine the data displayed by the box-and-whisker plot. Determine whether the distribution is symmetrical, skewed to the left, or skewed to the right. Justify your selection. Grams of Fat in Food Items at Beef Barn 10 20 30 Focus prds English (United States)arrow_forwardConstruct a histogram displaying your data. In complete sentences, describe the shape of your graph. Construct a box plot displaying your data. Does the middle 50% of the data appear to be concentrated together or spread apart? Explain how you determined this. Looking at both the histogram and the box plot, discuss the distribution of your data. alue smaller than 3 and larger than 5 will be considered an outlier.arrow_forwardI need help with instructions to on how to identify which box plots corresponds with each histogram. It’s more confusing bc there’s no numbers to calculate for a median , etc.arrow_forward
- We have provided simple data sets for you to practice the basics of finding measures of variation. For each data set, determine the a. range. b. sample standard deviation. 4, 2, 0, 2, 2arrow_forwardDetermine whether the following statement is true or false. If it is false, rewrite it as a true statement. The mean is the measure of central tendency most likely to be affected by an outlier. Choose the correct answer below. OA. The statement is false. Outliers do not affect any measure of central tendency. B. The statement is false. The mode is the measure of central tendency most likely to be affected by an outlier. OC. The statement is false. The median is the measure of central tendency most likely to be affected by an outlier. OD. The statement is true.arrow_forwardSolution for Consider the following data of 14 mathematics exam scores 15, 28, 57, 58, 64, 69, 74, 79, 80, 83, 85, 92, 95, and 100. Find the five number summary contract a box plot , a modified box plot . What is the shape . Are there any outliers. Find the 45 percentilearrow_forward
- Is parameter proportion the same as statistical proportion. so lets say the statistical proportion is 0.49. Would the parameter proportion be 0.49 as well ?arrow_forwardExplain your answers pleasearrow_forwardClasswork 2Use the following stem-and-leaf plot to recover the original data. Then create afrequency histogram starting at 0 and with a class width of 10. You can use StatCrunch to makethe histogram and copy it to your worksheet or draw it out by hand. Either way, make sure tolabel the x-axis Test Scores. Do there appear to be any outliers? Explain.Variable: Test ScoresDecimal point is 1 digit(s) to the right of the colon.Leaf unit = 11 : 22 :3 :4 : 5575 : 1686 : 077 : 47898 : 003999 : 610 : 1arrow_forward
arrow_back_ios
SEE MORE QUESTIONS
arrow_forward_ios
Recommended textbooks for you
 MATLAB: An Introduction with ApplicationsStatisticsISBN:9781119256830Author:Amos GilatPublisher:John Wiley & Sons Inc
 Probability and Statistics for Engineering and th...StatisticsISBN:9781305251809Author:Jay L. DevorePublisher:Cengage Learning
 Statistics for The Behavioral Sciences (MindTap C...StatisticsISBN:9781305504912Author:Frederick J Gravetter, Larry B. WallnauPublisher:Cengage Learning
 Elementary Statistics: Picturing the World (7th E...StatisticsISBN:9780134683416Author:Ron Larson, Betsy FarberPublisher:PEARSON
 The Basic Practice of StatisticsStatisticsISBN:9781319042578Author:David S. Moore, William I. Notz, Michael A. FlignerPublisher:W. H. Freeman
 Introduction to the Practice of StatisticsStatisticsISBN:9781319013387Author:David S. Moore, George P. McCabe, Bruce A. CraigPublisher:W. H. Freeman

MATLAB: An Introduction with Applications
Statistics
ISBN:9781119256830
Author:Amos Gilat
Publisher:John Wiley & Sons Inc

Probability and Statistics for Engineering and th...
Statistics
ISBN:9781305251809
Author:Jay L. Devore
Publisher:Cengage Learning

Statistics for The Behavioral Sciences (MindTap C...
Statistics
ISBN:9781305504912
Author:Frederick J Gravetter, Larry B. Wallnau
Publisher:Cengage Learning

Elementary Statistics: Picturing the World (7th E...
Statistics
ISBN:9780134683416
Author:Ron Larson, Betsy Farber
Publisher:PEARSON

The Basic Practice of Statistics
Statistics
ISBN:9781319042578
Author:David S. Moore, William I. Notz, Michael A. Fligner
Publisher:W. H. Freeman

Introduction to the Practice of Statistics
Statistics
ISBN:9781319013387
Author:David S. Moore, George P. McCabe, Bruce A. Craig
Publisher:W. H. Freeman