
ENGR.ECONOMIC ANALYSIS
14th Edition
ISBN: 9780190931919
Author: NEWNAN
Publisher: Oxford University Press
expand_more
expand_more
format_list_bulleted
Related questions
Question
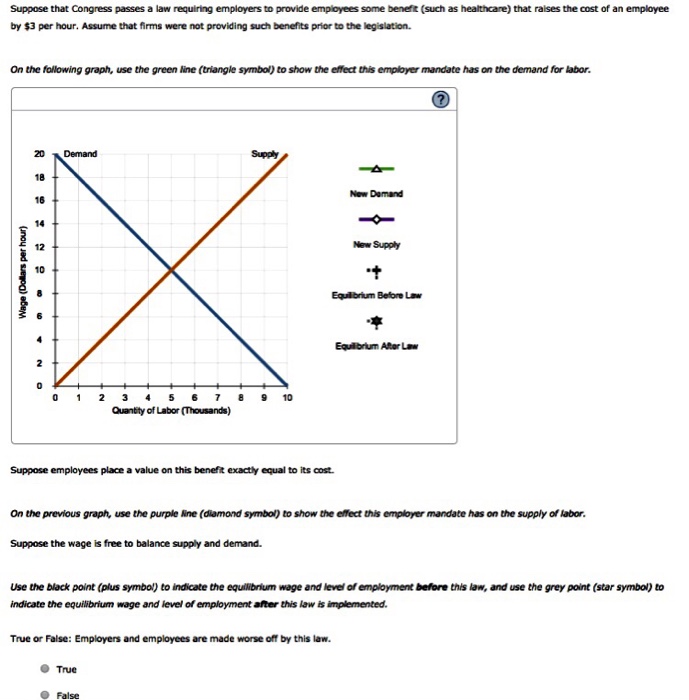

Transcribed Image Text:Suppose that Congress passes a law requiring employers to provide employees some benefit (such as healthcare) that raises the cost of an employee
by $3 per hour. Assume that firms were not providing such benefits prior to the legislation.
On the following graph, use the green line (triangle symbol) to show the effect this employer mandate has on the demand for labor.
Wage (Dollars per hour)
20
18
16
14
12
10
8
2
0
0
Demand
1
2 3 4 567
Quantity of Labor (Thousands)
Supply
9 10
True
Suppose employees place a value on this benefit exactly equal to its cost.
False
New Demand
Equilibrium Before Law
True or False: Employers and employees are made worse off by this law.
New Supply
On the previous graph, use the purple line (diamond symbol) to show the effect this employer mandate has on the supply of labor.
Suppose the wage is free to balance supply and demand.
Equilibrium After Law
Use the black point (plus symbol) to indicate the equilibrium wage and level of employment before this law, and use the grey point (star symbol) to
indicate the equilibrium wage and level of employment after this law is implemented.

Transcribed Image Text:Suppose that, before the mandate, the wage in this market was $2 above the minimum wage.
In this case, the wage rate with the employer mandate will be $
in the level of unemployment.
Now suppose that workers do not value the mandated benefit at all.
per hour, which will lead to
Which of the following statements are true under this circumstance? Check all that apply.
The wage rate will decline by less than $3.
Employees are worse off than before the mandated benefit.
Employers are neither better nor worse off than before the mandated benefit.
The equilibrium quantity of labor will remain unchanged.
The supply curve of labor shifts to the left.
0
in the level of employment and
Expert Solution
This question has been solved!
Explore an expertly crafted, step-by-step solution for a thorough understanding of key concepts.

Step by stepSolved in 4 steps with 4 images

Knowledge Booster


Learn more about
Need a deep-dive on the concept behind this application? Look no further. Learn more about this topic, economics and related others by exploring similar questions and additional content below.Similar questions
- RATE 4. Excess supply with union wages Consider the housing construction industry. Assume that the industry is perfectly competitive in both input and output markets. Suppose that, through collective bargaining, a labor union negotiates an industry-wide wage for various kinds of labor (electricians, plumbers, and so on). In particular, it succeeds in negotiating a wage increase for carpenters from $30 to $40 per hour. The following graph shows the labor demand of an individual firm. On the following graph, show what happens at the firm level as a result of the union negotiations. 10 20 50 24 72 QUANTITY OF LABOR Demand 120 Demand Supply Supply Now consider the effects of the wage change on the entire industry. Use the graph input tool to help you answer the following questions. You will not be graded on any changes you make to this graph. Note: Once you enter a value in a white field, the graph and any corresponding amounts in each grey field will change accordingly. WAGE RATE (Dollars…arrow_forward3. Union and Labor Market Efficiency (a) Given an inverse labor demand function of w = 30 - 0.02LD, find the elasticity of labor demand when w = 10. Does the firm pay out more to its workers by increasing wages?arrow_forwardThe table below describes labor supply and labor demand schedules. Wage $15 $16 Labor supply 400 workers 500 workers 600 workers $17 $18 $19 $20 $21 Find the equilibrium amount of employment in this market. Type your answer.... 700 workers 800 workers 900 workers 1,000 workers Labor demand 1,000 workers 900 workers 800 workers 700 workers 600 workers 500 workers 400 workers Nextarrow_forward
- 14. The figure shows the supply and demand for labor in the textile industry. In each of the following scenarios, identify the direction of the shift in either the supply or demand curve and state whether the resulting equilibrium wage and quantity increase or decrease. What are the original equilibrium wage and quantity? Immigration and layoffs from other jobs increase the population of textile workers. A new technology for making self-printed T-shirts reduces the marginal product of labor for textile workers.arrow_forwardThe following graph shows the labor market in the fast-food industry in the fictional town of Supersize City. Use the graph input tool to help you answer the following questions. You will not be graded on any changes you make to this graph. Note: Once you enter a value in a white field, the graph and any corresponding amounts in each grey field will change accordingly. WAGE (Dollars per hour) 20 18 16 14 12 2 0 0 Supply Demand 90 180 270 360 450 540 630 720 810 900 LABOR (Thousands of workers) In this market, the equilibrium hourly wage is $ Graph Input Tool Market for Labor in the Fast Food Industry Wage (Dollars per hour) Labor Demanded (Thousands of workers) 6 900 and the equilibrium quantity of labor is Labor Supplied (Thousands of workers) ? 378 thousand workers.arrow_forwardThe table below shows the quantity demanded and supplied at various wage rates for a competitive market. Wage Rate Quantity of Workers Demanded Quantity of Workers Supplied $100 5 50 90 10 45 80 20 40 70 35 35 60 50 30 If the workers form a union and negotiate a weekly wage of $90, how many workers will be supplied and demanded? Multiple Choice The quantity demand will be 10 and the quantity supplied will be 35. The quantity demanded will be 10 and the quantity supplied will be 45. The quantity demand and supplied will both be 35. The quantity demanded will be 35 and the quantity supplied will be 45.arrow_forward
- Problem IV Consider a perfectly competitive labor market in which the demand for labor is given by E = 48,000-(2,000/3)W, and the supply of labor is given by E = -8,000 + 1,000W. In these equations, E is the number of employee-hours per day, and W is the hourly wage. a. What is the equilibrium number of employee-hours each day? b. Compute the employer surplus and the workers surplus c. Suppose the government imposes a minimum wage of $24 per hour. What will be the resulting number of employee-hours after the imposition of this minimum wage? d. What is the number of employee-hours per day hired and the number of employees e. Based on the question © Compute the employer surplus and the workers surplus f. Compute the dead weight loss in this labor market with minimum wagearrow_forwardMolly owns a company that gives one-on-one skiing lessons. She is deciding how many ski instructors to hire. The price of a ski class is $100, and the equilibrium wage for a ski instructor is $300 per day. According to the table below and the Rational Rule for Employers, how many ski instructors should Molly hire? Total number of Number of ski ski lessons instructors 1 8 2 14 3 17 4 19 20 A) 1 B) 2 C) 3 D) 4 E) 5arrow_forwardThe table shows levels of employment (Labor), the marginal product of each of those levels, and a monopoly's marginal revenue. What is the monopoly's marginal revenue product at each level of employment? If the monopoly operates in a perfectly competitive labor market where the going market wage is $20, what is the firm's profit maximizing level of employment?arrow_forward
- Economics Suppose that Congress passes a law requiring employers to provide employees some benefit (such as healthcare) that raises the cost of an employee by $3 per hour. Assume that firms were not providing such benefits prior to the legislation. On the following graph, use the green line (triangle symbel) to show the effect this employer mandate has on the demand for labor. Demand Supply 20 18 New Demand 10 14 12 New Supply 10 Equilibrium Before Law Equilibrium After Law 0 1 2 5 10 Quantity of Labor (Thousands) Suppose employees place a value on this benefit exactly equal to its cost. On the preceding graph, use the purple line (diamond symbol) to show the effect this employer mandate has on the supply of labor. Suppose the wage is free to balance supply and demand. Use the black point (plus symbol) to indicate the eauilibrium wage and level of employment before this law, and use the grey point (star symbol) to indicate the equilibrium wage and level of employment after this law is…arrow_forwardGraph the original and new equilibrium. The pilot's union at all major air carriers has demanded and been granted a 20 percent pay increase. What will happen in the air travel market? How would this result differ if the demand for air travel was more elastic at the original equilibrium price?arrow_forward(c) Let us now turn to the labor market for grocery store workers in Little town. Recently one of the last two grocery stores in Little town closed leaving only one employer for grocery store workers in this area. This labor market is not very competitive. What type of market structure is this? (d) Draw a typical supply curve (i.e. average expenditure), marginal expenditure, and demand for the grocery store in Little Town. Label the equilibrium wage and number of grocery store workers. (e) Suppose that some time has passed and the population has grown in Little Town and there are now many grocery stores. Now suppose that the grocery store workers unionize. Draw a graph to depict the equilibrium wage and number of workers in this new market.arrow_forward
arrow_back_ios
SEE MORE QUESTIONS
arrow_forward_ios
Recommended textbooks for you
 Principles of Economics (12th Edition)EconomicsISBN:9780134078779Author:Karl E. Case, Ray C. Fair, Sharon E. OsterPublisher:PEARSON
 Engineering Economy (17th Edition)EconomicsISBN:9780134870069Author:William G. Sullivan, Elin M. Wicks, C. Patrick KoellingPublisher:PEARSON
 Principles of Economics (MindTap Course List)EconomicsISBN:9781305585126Author:N. Gregory MankiwPublisher:Cengage Learning
 Managerial Economics: A Problem Solving ApproachEconomicsISBN:9781337106665Author:Luke M. Froeb, Brian T. McCann, Michael R. Ward, Mike ShorPublisher:Cengage Learning
 Managerial Economics & Business Strategy (Mcgraw-...EconomicsISBN:9781259290619Author:Michael Baye, Jeff PrincePublisher:McGraw-Hill Education
Principles of Economics (12th Edition)
Economics
ISBN:9780134078779
Author:Karl E. Case, Ray C. Fair, Sharon E. Oster
Publisher:PEARSON
Engineering Economy (17th Edition)
Economics
ISBN:9780134870069
Author:William G. Sullivan, Elin M. Wicks, C. Patrick Koelling
Publisher:PEARSON
Principles of Economics (MindTap Course List)
Economics
ISBN:9781305585126
Author:N. Gregory Mankiw
Publisher:Cengage Learning
Managerial Economics: A Problem Solving Approach
Economics
ISBN:9781337106665
Author:Luke M. Froeb, Brian T. McCann, Michael R. Ward, Mike Shor
Publisher:Cengage Learning
Managerial Economics & Business Strategy (Mcgraw-...
Economics
ISBN:9781259290619
Author:Michael Baye, Jeff Prince
Publisher:McGraw-Hill Education