Managerial Accounting
15th Edition
ISBN: 9781337912020
Author: Carl Warren, Ph.d. Cma William B. Tayler
Publisher: South-Western College Pub
expand_more
expand_more
format_list_bulleted
Question
Calculate the following ratios for Year 4 and Year 3. Since Year 2 numbers are not presented do not use averages when calculating the ratios for Year 3. Instead, use the number presented on the Year 3 balance sheet.
Note: Round ratio answers to 2 decimal places unless otherwise indicated.
- Working capital.
Current ratio .- Quick ratio.
- Receivables turnover (beginning receivables at January 1, Year 3, were $44,000).
- Average days to collect
accounts receivable .Note: Use 365 days in a year. Round your intermediate calculations to 2 decimal places and your final answers to the nearest whole number.
- Inventory turnover (beginning inventory at January 1, Year 3, was $150,000).
- Number of days to sell inventory.
Note: Use 365 days in a year. Round your intermediate calculations to 2 decimal places and your final answers to the nearest whole number.
- Debt-to-assets ratio.
Note: Round your answers to the nearest whole percent.
- Debt-to-equity ratio.
- Number of times interest was earned.
- Plant assets to long-term debt.
- Net margin.
- Turnover of assets (average total assets in Year 3 is $504,000).
Return on investment (average total assets in Year 3 is $504,000).- Return on
equity (average stockholders ' equity in Year 3 is $271,700). - Earnings per share (total shares outstanding is unchanged).
- Book value per share of common stock.
- Price-earnings ratio (market price per share: Year 3, $12.25; Year 4, $13.50).
Note: Round your intermediate calculations and final answer to 2 decimal places.
- Dividend yield on common stock.

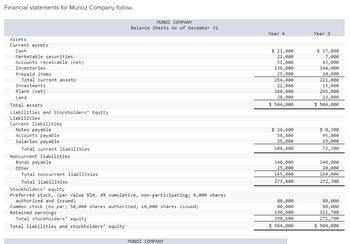
Transcribed Image Text:Financial statements for Munoz Company follow.
MUNOZ COMPANY
Balance Sheets As of December 31
Year 4
Year 3
Assets
Current assets
Cash
Marketable securities
Accounts receivable (net)
Inventories
Prepaid items
Total current assets
Investments
Plant (net)
Land
Total assets
Liabilities and Stockholders' Equity
Liabilities
Current liabilities
Notes payable
Accounts payable
Salaries payable
Total current liabilities
Noncurrent liabilities
Bonds payable
$ 21,000
21,000
$ 17,000
7,000
51,000
43,000
136,000
144,000
25,000
10,000
221,000
15,000
254,000
22,000
260,000
28,000
$ 564,000
245,000
23,000
$ 504,000
$ 24,600
58,800
25,000
$ 8,300
45,000
19,000
108,400
72,300
140,000
140,000
Other
25,000
20,000
Total noncurrent liabilities
165,000
160,000
Total liabilities
273,400
232,300
Stockholders' equity
Preferred stock, (par value $10, 4% cumulative, non-participating; 8,000 shares
authorized and issued)
Common stock (no par; 50,000 shares authorized; 10,000 shares issued)
Retained earnings
Total stockholders' equity
Total liabilities and stockholders' equity
80,000
80,000
80,000
80,000
130,600
111,700
290,600
271,700
$ 564,000
$ 504,000
MUNOZ COMPANY

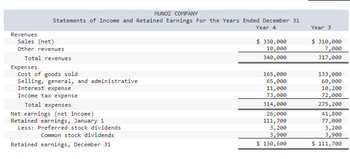
Transcribed Image Text:Revenues
Sales (net)
MUNOZ COMPANY
Statements of Income and Retained Earnings For the Years Ended December 31
Year 3
Other revenues
Total revenues
Expenses
Cost of goods sold
Selling, general, and administrative
Interest expense
Income tax expense
Total expenses
Net earnings (net income)
Retained earnings, January 1
Less: Preferred stock dividends
Common stock dividends
Retained earnings, December 31
Year 4
$ 330,000
10,000
$ 310,000
7,000
340,000
317,000
165,000
133,000
65,000
60,000
11,000
10,200
73,000
72,000
314,000
275,200
26,000
41,800
111,700
77,000
3,200
3,200
3,900
3,900
$ 130,600
$ 111,700
Expert Solution
This question has been solved!
Explore an expertly crafted, step-by-step solution for a thorough understanding of key concepts.
Step by stepSolved in 2 steps

Knowledge Booster
Similar questions
- Income Statement Ratio The income statement of Holly Enterprises shows operating revenues of $134,800, selling expenses of $38,310, general and administrative expenses of $36,990, interest expense of $580, and income tax expense of $13,920. Hollys stockholders equity was $280,000 at the beginning of the year and $320,000 at the end of the year. The company has 20,000 shares of stock outstanding at the end of the year. Required Compute Hollys profit margin. What other information would you need in order to comment on whether this ratio is favorable?arrow_forwardThe income statement, statement of retained earnings, and balance sheet for Somerville Company are as follows: Includes both state and federal taxes. Refer to the information for Somerville Company on the previous pages. Also, assume that the price per common share for Somerville is 8.10. Required: Compute the price-earnings ratio. (Note: Round the answer to two decimal places.)arrow_forwardSales transactions Using transactions listed in P4-2, indicate the effects of each transaction on the liquidity metric working capital and profitability metric gross profit percent. Indicate the gross profit percent for each sale (rounding to one decimal place) in parentheses next to the effect of the sale on the company’s ability to attain an overall gross profit percent of 30%.arrow_forward
- 23arrow_forwardThe Statement of Comprehensive Income for the year ended 31 December 2014 Parent plc Subsid plc Sales Revenue Cost of Sales Gross Profit Expenses Dividend received from Subsid plc Profit before tax Income Tax expense Profit after tax Dividends paid 830,000 235,000 597.500 142.500 232,500 92.500 76,750 60,000 4,500 160,250 32,500 25.750 16.750 134,500 15.750 6.000 90.000 44,500 9.750 Retained Earnings brought forward from previous lyears 211.500 124.500 256.000 134,250 Parent plc acquired 75% of the shares in Subsid plc on 1 January 2010 when Subsid's retained earnings were £70,000. Non-controlling interests are measured using Method 1. During the year Parent plc sold Subsid plc goods for £30,000 which represented cost plus 25%. 30% of these goods were still in stock at the end of the year. During the year Parent plc and Subsid plc paid dividends of £90,000 and £6,000 respectively. The opening balances of retained earnings for the two companies were £211,500 and £124,500 respectively.…arrow_forwardSales Cost of goods sold Gross profit Selling expenses Administrative expenses Total expenses Income before taxes. Income tax expense Net income Assets Current assets Long-term investments Plant assets, net Total assets Sin Comparative Income Statements For Years Ended December 31 2021 $ 420,027 252,856 167,171 59,644 37,802 97,446 69,725 12,969 $ 56,756 Liabilities and Equity Current liabilities Common stock Other paid-in capital Retained earnings Total liabilities and equity Assets Current assets Long-term investments Plant assets, net. Total assets Liabilities and Equity Current liabaties Common stock Other paid-in capital Retained earnings Total liabilities and equity 2020 $ 321,775 202,718 KORBIN COMPANY Comparative Balance Sheets December 31 2021 119,057 44,405 28,316 72,721 46,336 9,499 $ 36,837 $ 55,286 0 102,674 $ 157,960 2020 3. Complete the below table to calculate the balance sheet data in trend percents with 2019 as answers to 2 decimal places.) 111.77 % 0.00 $ 37,003 700…arrow_forward
- SalesOperating costs (excluding depreciation and amortization) EBITDADepreciation and amortization Earnings before interest and taxes Interest Earnings before taxesTaxes (40%)Net income available to common stockholders Common dividendsSEBRINGCORPORATION: BALANCESHEETSFORYEARENDINGDECEMBER31 (FIGURES ARE STATED IN MILLIONS) Assets: Cash and marketable securities Accounts receivableInventories Total current assets Gross Fixed Assets Less DepreciationNet plant and equipment Total assets 2005 2004 $3,600.0 $3,000.0 $3,060.0 $2,550.0 $540.0 $450.0 90.0 75.0 $450.0 $375.0 65.0 60.0 $385.0 $315.0 154.0 126.0 $231.0 $189.0 $15.0 $13.0 2005 2004 $ 36.00 $ 30.00 $ 340.00 $ 250.00 $ 457.00 $ 351.00 $ 833.00 $ 631.00 $ 1,065.00 $ 825.00 $ (165.00) $ (75.00) $ 900.00 $ 750.00 $ 1,733.00 $ 1,381.00 $ 324.00 $ 270.00 $ 201.00 $ 155.00 $ 216.00 $ 180.00 $ 741.00 $ 605.00 $ 450.00 $ 450.00 $ 1,191.00 $ 1,055.00 $ 150.00 $ 150.00 $ 392.00 $ 176.00 $ 542.00 $ 326.00 $ 1,733.00 $ 1,381.00…arrow_forwardNet sales Cost of goods sold Selling and administrative expenses Interest expense Other income (expense) Income tax expense Net income Current assets Noncurrent assets Total assets Current liabilities Long-term debt Total stockholders' equity Total liabilities and stockholders' equity Total assets Total stockholders' equity Current liabilities Target Corporation Income Statement Data for Year $65,357 45,583 15,101 707 (94) 1,384 $ 2,488 $18,424 26,109 Balance Sheet Data (End of Year) $44,533 $11,327 17,859 15,347 Walmart Inc. $44,533 $408,214 304,657 79,607 10,512 2,065 (411) 7,139 $ 14,335 $48,331 122,375 $170,706 $55,561 44,089 71,056 $170,706 Beginning-of-Year Balances $44,106 13,712 $163,429 65,682 55,390arrow_forwardPE.17-09B - Return on total assets A company reports the following income statement and balance sheet information for the current year: Net income Interest expense Average total assets $410,000 90,000 5,000,000 Determine the return on total assets. I %arrow_forward
- The trial balance of Kroeger Incorporated included the following accounts as of December 31, 2024: Sales revenue Interest revenue Gain on sale of investments Gain on debt securities Loss on projected benefit obligation Cost of goods sold Selling expense Goodwill impairment loss Interest expense General and administrative expense Debits $ 160,000 6,100,000 600,000 500,000 30,000 500,000 Credits $ 8,200,000 60,000 120,000 140,000 The gain on debt securities represents the increase in the fair value of debt securities and is classified a component of other comprehensive income. Kroeger had 300,000 shares of stock outstanding throughout the year. Income tax expense has not yet been recorded. The effective tax rate is 25%. Required: Prepare a 2024 single, continuous statement of comprehensive income for Kroeger Incorporated. Use a multiple-step income statement format. Note: Round earnings per share answer to 3 decimal places.arrow_forwardComprehensive Question Ch4: Par Corporation acquired a 70 percent interest in Sul Corporation's outstanding voting common stockon January 1, 2011, for $490,000 cash. The stockholders' equity (book value) of Sul on this date consisted of $500,000 capital stock and $100,000 retained earnings. The differences between the fair valueof Sul and the book value of Sul were assigned $5,000 to Sul's undervalued inventory, $14,000 to undervalued buildings, $21,000 to undervalued equipment, and $40,000 to previously unrecorded patents. Any remaining excess is goodwill. The undervalued inventory items were sold during 2011, and the undervalued buildings andequipment had remaining useful lives of seven years and three years, respectively. The patents have a 40- year life. Depreciation is straight line.At December 31, 2011, Sul's accounts payable include $10,000 owed to Par. This $10,000account payable is due on January 15, 2012. Separate financial statements for Par and Sul at 31 Dec- 2011 are…arrow_forwardIncome Statement Sales revenue Cost of goods sold Gross profit Operating expenses (including interest on bonds) Pretax income Income tax Net income Balance Sheet Cash Accounts receivable (net) Merchandise inventory Prepaid expenses Property and equipment (net) Total assets Accounts payable Income taxes payable Bonds payable (interest rate: 10%) Common stock ($10 par value, 10,000 shares outstanding) Retained earnings Total liabilities and stockholders' equity Year 2 $453,000 250,000 203,000 167,000 36,000 10,800 $ 25,200 $ 6,800 42,000 25,000 200 130,000 $204,000 $ 17,000 1,000 70,000 100,000 16,000 $204,000 Year 1 $447,000 241,000 206,000 168,000 38,000 11,400 $ 26,600 $ 3,900 29,000 18,000 100 120,000 $171,000 $ 18,000 1,000 50,000 100,000 2,000 $171,000 Required: Interpret each element of the ratio analysis separately. Ensure accuracy by analyzing each ratio individually!arrow_forward
arrow_back_ios
SEE MORE QUESTIONS
arrow_forward_ios
Recommended textbooks for you
 Managerial AccountingAccountingISBN:9781337912020Author:Carl Warren, Ph.d. Cma William B. TaylerPublisher:South-Western College Pub
 Financial And Managerial AccountingAccountingISBN:9781337902663Author:WARREN, Carl S.Publisher:Cengage Learning,
 Financial Accounting: The Impact on Decision Make...AccountingISBN:9781305654174Author:Gary A. Porter, Curtis L. NortonPublisher:Cengage Learning
 Managerial Accounting: The Cornerstone of Busines...AccountingISBN:9781337115773Author:Maryanne M. Mowen, Don R. Hansen, Dan L. HeitgerPublisher:Cengage Learning
 Survey of Accounting (Accounting I)AccountingISBN:9781305961883Author:Carl WarrenPublisher:Cengage Learning

Managerial Accounting
Accounting
ISBN:9781337912020
Author:Carl Warren, Ph.d. Cma William B. Tayler
Publisher:South-Western College Pub

Financial And Managerial Accounting
Accounting
ISBN:9781337902663
Author:WARREN, Carl S.
Publisher:Cengage Learning,

Financial Accounting: The Impact on Decision Make...
Accounting
ISBN:9781305654174
Author:Gary A. Porter, Curtis L. Norton
Publisher:Cengage Learning

Managerial Accounting: The Cornerstone of Busines...
Accounting
ISBN:9781337115773
Author:Maryanne M. Mowen, Don R. Hansen, Dan L. Heitger
Publisher:Cengage Learning


Survey of Accounting (Accounting I)
Accounting
ISBN:9781305961883
Author:Carl Warren
Publisher:Cengage Learning