
MATLAB: An Introduction with Applications
6th Edition
ISBN: 9781119256830
Author: Amos Gilat
Publisher: John Wiley & Sons Inc
expand_more
expand_more
format_list_bulleted
Related questions
Concept explainers
Topic Video
Question
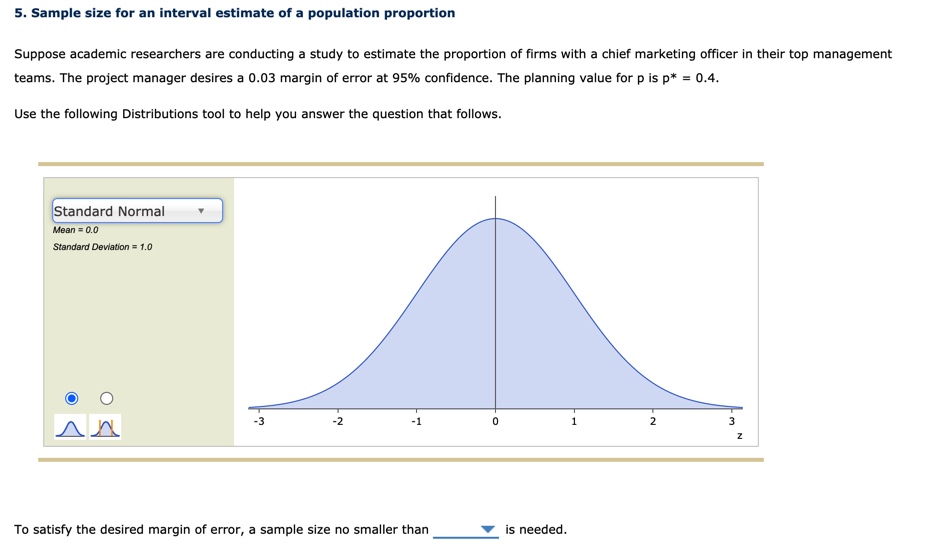

Transcribed Image Text:5. Sample size for an interval estimate of a population proportion
Suppose academic researchers are conducting a study to estimate the proportion of firms with a chief marketing officer in their top management
teams. The project manager desires a 0.03 margin of error at 95% confidence. The planning value for p is p* = 0.4.
Use the following Distributions tool to help you answer the question that follows.
Standard Normal
Mean = 0.0
Standard Devlation = 1.0
-3
-2
-1
2
3
To satisfy the desired margin of error, a sample size no smaller than
is needed.
1.
Expert Solution
This question has been solved!
Explore an expertly crafted, step-by-step solution for a thorough understanding of key concepts.

Step by stepSolved in 2 steps with 1 images

Knowledge Booster


Learn more about
Need a deep-dive on the concept behind this application? Look no further. Learn more about this topic, statistics and related others by exploring similar questions and additional content below.Similar questions
- A study is designed to determine the effect of an office-training course on typing productivity. Fifteen typists who have not taken the course are randomly selected. The investigator assigns 20 pages of equally difficult text to be typed by each typist both before and after completing the training course. The investigator wants to find out whether the training course has reduced the number of errors by more than 10. Define d = Before − After. Significance level What conclusion should we reach if the p-value is 0.113?arrow_forwardFind the power of the test for each combination of effect size and total sample size below (remember, when entering sample sizes into jamovi, you are entering the sample size for one group), and round your answers to three decimal places.Assuming effect size = 0.5: i. When total n = 6, power = ii. When total n = 30, power = iii. When total n = 80, power = For effect size = 0.8: i. When total n = 6, power = ii. When total n = 30, power =iii. When total n = 80, power =arrow_forwardAspen Plastics produces plastic bottles to customer order. The quality inspector randomly selects four bottles from the bottle machine and measures the outside diameter of the bottleneck, a critical quality dimension that determines whether the bottle cap will fit properly. The dimensions (inch) from the last six samples are: BOTTLE Sample 1 2 3 4 1 0.694 0.622 0.698 0.69 2 0.687 0.611 0.697 0.613 3 0.671 0.680 0.695 0.602 4 0.610 0.615 0.685 0.678 5 0.680 0.624 0.618 0.614 6 0.685 0.693 0.607 0.669 What would be the lower control limits of a 3-sigma ?¯x¯ chart? ( x bar chart )arrow_forward
- Rick O'Shea is a candidate for governor of a big state. To get the latest voter opinion poll, his campaign organization obtains a random sample of likely voters. The sample is located in Worksheet "DATA13". 13 The point estimate of the population proportion is, a 0.531 b 0.542 c 0.553 d 0.564arrow_forwardYou are working on the design for a study on the proportion of adults who work remotely in the U.S. The original design sought to limit the margin of error to 0.1 and the new design seeks to limit the margin of error to 0.01. What must be the corresponding change to the minimum sample size? A. It must increase B. Nothing, because the minimum sample size doesn't depend on margin of error C. It must decreasearrow_forwardWhat happens to the minimum sample size needed to estimate p when the acceptable margin of error increases? O A. the minimum sample size does not change B. the minimum sample size decreases C. the minimum sample size increasesarrow_forward
- In a t-test of difference between means, increasing sample size will affect the:arrow_forwardIf s = 15 and the estimated standard error is 5, then the sample size must be equal to ______.arrow_forwardIn a completely randomized design experiment, 10 experimental units were randomly chosen for each of three treatment groups and a quantity was measured for each unit within each group. In the first steps of testing whether the means of the three groups are the same, the sum of squares for treatments was calculated to be 3,110 and the sum of squares for error was calculated to be 27,000. Complete the ANOVA table. Source df SS MS F Treatments Error Totalarrow_forward
- Dasani has two machines at a particular plant that are used for filling their plastic water bottles (nominal volume 16 ounces). The quality engineering department tells the plant manager that both machines fill to the same net volume (whether or not this volume averages 16.0 ounces). A random sample is taken from the output of the each machine. Table 1-Measured volume of water per bottle (fluid ounces) Machine 1 Machine 2 16.03 16.01 16.02 16.03 16.04 15.96 15.97 16.04 16.05 15.98 15.96 16.02 16.05 16.02 16.01 16.01 16.02 15.99 15.99 16.00 Do you think the quality engineering department is correct? Derive your answer from a complete hypothesis testing process.arrow_forwardI need help on my classworkarrow_forward
arrow_back_ios
arrow_forward_ios
Recommended textbooks for you
- MATLAB: An Introduction with ApplicationsStatisticsISBN:9781119256830Author:Amos GilatPublisher:John Wiley & Sons Inc
 Probability and Statistics for Engineering and th...StatisticsISBN:9781305251809Author:Jay L. DevorePublisher:Cengage Learning
 Statistics for The Behavioral Sciences (MindTap C...StatisticsISBN:9781305504912Author:Frederick J Gravetter, Larry B. WallnauPublisher:Cengage Learning
  Elementary Statistics: Picturing the World (7th E...StatisticsISBN:9780134683416Author:Ron Larson, Betsy FarberPublisher:PEARSON
 The Basic Practice of StatisticsStatisticsISBN:9781319042578Author:David S. Moore, William I. Notz, Michael A. FlignerPublisher:W. H. Freeman
 Introduction to the Practice of StatisticsStatisticsISBN:9781319013387Author:David S. Moore, George P. McCabe, Bruce A. CraigPublisher:W. H. Freeman
MATLAB: An Introduction with Applications
Statistics
ISBN:9781119256830
Author:Amos Gilat
Publisher:John Wiley & Sons Inc
Probability and Statistics for Engineering and th...
Statistics
ISBN:9781305251809
Author:Jay L. Devore
Publisher:Cengage Learning
Statistics for The Behavioral Sciences (MindTap C...
Statistics
ISBN:9781305504912
Author:Frederick J Gravetter, Larry B. Wallnau
Publisher:Cengage Learning
Elementary Statistics: Picturing the World (7th E...
Statistics
ISBN:9780134683416
Author:Ron Larson, Betsy Farber
Publisher:PEARSON
The Basic Practice of Statistics
Statistics
ISBN:9781319042578
Author:David S. Moore, William I. Notz, Michael A. Fligner
Publisher:W. H. Freeman
Introduction to the Practice of Statistics
Statistics
ISBN:9781319013387
Author:David S. Moore, George P. McCabe, Bruce A. Craig
Publisher:W. H. Freeman