
MATLAB: An Introduction with Applications
6th Edition
ISBN: 9781119256830
Author: Amos Gilat
Publisher: John Wiley & Sons Inc
expand_more
expand_more
format_list_bulleted
Related questions
Question
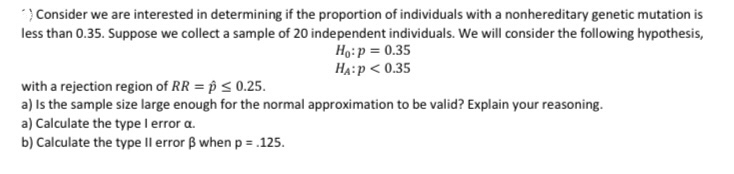

Transcribed Image Text:) Consider we are interested in determining if the proportion of individuals with a nonhereditary genetic mutation is
less than 0.35. Suppose we collect a sample of 20 independent individuals. We will consider the following hypothesis,
Ho:p = 0.35
HA:p < 0.35
with a rejection region of RR = p < 0.25.
a) Is the sample size large enough for the normal approximation to be valid? Explain your reasoning.
a) Calculate the type I error a.
b) Calculate the type Il error ß when p = .125.
Expert Solution
This question has been solved!
Explore an expertly crafted, step-by-step solution for a thorough understanding of key concepts.

This is a popular solution

Trending nowThis is a popular solution!

Step by stepSolved in 2 steps

Knowledge Booster

Similar questions
- For a given disease gene, specified mode of inheritance, and observed data set, if the p-value for a chi-square goodness of fit analysis is 0.001, and the significance level is 0.10, then we: a) make no decision. b) reject the null hypothesis that the disease follows the specified mode of inheritance at the given gene. c) reject the null hypothesis at the 0.0001 level. d) reject the null hypothesis that the disease does not follow the specified mode of inheritance at the given gene. e) accept the null hypothesis that the disease almost certainly follows the specified mode of inheritance at the given gene.arrow_forwardIn order to compare the life expectancies of three different brands of tires, 5 tires of each brand were randomly selected and were subjected to standard wear-testing procedures. Information regarding the three brands is shown below. Stone Bridge Michelle Nice Year Mean mileage (in 1000 miles) 42 46 41 Sample variance 3 2 5 Sample Size 5 5 5 Use the above data and test to see if the mean mileage for all three brands of tires is the same. Let α = .05. Complete the ANOVA table and show the details of calculation. a) State the null and alaternative hypotheses to be tested. b) Complete the table. The null hypothesis is to be tested at 95% confidence. You need to show all calculations. What do you conclude? Source of variation SS df MS F F critcal value Between Treatment SSTR= MSTR= Within Treatment SSE= MSE= Total SST=arrow_forwardIn a random sample of males, it was found that 29 write with their left hands and 212 do not. In a random sample of females, it was found that 70 write with their left hands and 444 do not. Use a 0.01 significance level to test the claim that the rate of left-handedness among males is less than that among females. Complete parts (a) through (c) below.arrow_forward
- 0. A high school principal claims that the variance in the GPA of students in the graduating class is Tess than 0.39. You test this claim by sampling 31 seniors and find their GPA have a variance or 0.21. Ho:o? Ha:o2 < 0.39 (Claim) = 0.39 Is there enough evidence to reject Ho and support the principal's claim at a 0.10 level of significance? ohs A. No, the test statistic x? B. No, the test statistic x2 = 16.154 is not in the rejection region with critical value 40.256 C. Yes, the test statistic x? D. No, the test statistic x2 = 21.434 is not in the rejection region with critical value 20.599 E. Yes, the test statistic x? = 16.154 is in the rejection region with critical value 20.599 = 20.599 is not in the rejection region with critical value 21.434 %3D 20.599 is in the rejection region with critical value 16.154 %Darrow_forwardGestation period is the length of pregnancy, or to be more precise, the interval between fertilization and birth. In Syrian hamsters, the average gestation period is 16 days. Suppose you have a sample of 31 Syrian hamsters who were exposed to high levels of the hormone progesterone when they were pups, and who have an average gestation length of 17.1 days and a sample variance of 26.0 days. You want to test the hypothesis that Syrian hamsters who were exposed to high levels of the hormone progesterone when they were pups have a different gestation length than all Syrian hamsters. Calculate the t statistic. To do this, you first need to calculate the estimated standard error. The estimated standard error is sMM= a. 31, b. 0.5232, c. 0.7328, d. 0.9158. The t statistic is- a. 1.50, b. 2.10, c. 2.63, d. 1.20 Now suppose you have a larger sample size n = 95. Calculate the estimated standard error and the t statistic for this sample with the same sample average and the same…arrow_forwardFil 10. A small pilot study is conducted to investigate the effect of a nutritional supplement on total body weight. Six participants agree to take the nutritional supplement. To assess its effect on body weight, weights are measured before starting the supplementation and then after 6 weeks. The data are shown below. Is there a significant increase in body weight following supplementation? Run the test at a 5% level of significance. Demonstrate the five steps for hypothesis testing and explain your results. Subject İnitial Weight Weight after 6 Weeks 1 155 157 2 142 145 3 176 180 4 180 175 210 209 6. 125 126arrow_forward
- A researcher randomly assigns college freshmen to either of two experimental conditions. Because both groups consist of college freshmen, someone claims that it is appropriate to use a t test for the two related samples. Comments?arrow_forwardI need help on my classworkarrow_forwardDr. Maddan's eye drops are supposed to cause significant reduction is eye redness. The following table shows the results of a recent study where a random sample of individuals took part in a placebo controlled study. No Reduction in Redness Reduction in Redness Total Eye Drops 120 220 340 No Eye Drops Total 120 140 260 240 360 600 With 5% level of significance, determine if eye redness reduction is dependent upon taking the eye drops. Provide, a. the Chi-square statistic. b. the critical value or the p-value. c. Your decision on whether or not to reject Ho.arrow_forward
- Your restaurant believes that the average bill for a party of four exceeds $100. To test this a random sample of 25 parties is selected. The average bill comes to $108 with a variance of $225. a. Set up hypotheses to see if the average bill exceeds $100. b. Report your result along with the p value or alpha (Type I error) level of your choosing. c. Offer your conclusions.arrow_forwardProvide an appropriate response. Test the hypothesis that p1 = P2. Use a = 0.05. The sample statistics listed below are from independent samples. Sample statistics: n1 = 50, x1 35, and n2 = 60, x2 = 40 Step 1) State the null and alternative hypotheses. Step 2) Determine the critical value for the level of significance, a. Step 3) Find the test statistic or P-value. Step 4) Will the researcher reject the null hypothesis or do not the null hypothesis: Step 5) Write the conclusion. HTML Editor BIUA A、IE三= Ex x E 曲。 12pt Pa SAMSUNG 10arrow_forward
arrow_back_ios
arrow_forward_ios
Recommended textbooks for you
- MATLAB: An Introduction with ApplicationsStatisticsISBN:9781119256830Author:Amos GilatPublisher:John Wiley & Sons Inc
 Probability and Statistics for Engineering and th...StatisticsISBN:9781305251809Author:Jay L. DevorePublisher:Cengage Learning
 Statistics for The Behavioral Sciences (MindTap C...StatisticsISBN:9781305504912Author:Frederick J Gravetter, Larry B. WallnauPublisher:Cengage Learning
  Elementary Statistics: Picturing the World (7th E...StatisticsISBN:9780134683416Author:Ron Larson, Betsy FarberPublisher:PEARSON
 The Basic Practice of StatisticsStatisticsISBN:9781319042578Author:David S. Moore, William I. Notz, Michael A. FlignerPublisher:W. H. Freeman
 Introduction to the Practice of StatisticsStatisticsISBN:9781319013387Author:David S. Moore, George P. McCabe, Bruce A. CraigPublisher:W. H. Freeman
MATLAB: An Introduction with Applications
Statistics
ISBN:9781119256830
Author:Amos Gilat
Publisher:John Wiley & Sons Inc
Probability and Statistics for Engineering and th...
Statistics
ISBN:9781305251809
Author:Jay L. Devore
Publisher:Cengage Learning
Statistics for The Behavioral Sciences (MindTap C...
Statistics
ISBN:9781305504912
Author:Frederick J Gravetter, Larry B. Wallnau
Publisher:Cengage Learning
Elementary Statistics: Picturing the World (7th E...
Statistics
ISBN:9780134683416
Author:Ron Larson, Betsy Farber
Publisher:PEARSON
The Basic Practice of Statistics
Statistics
ISBN:9781319042578
Author:David S. Moore, William I. Notz, Michael A. Fligner
Publisher:W. H. Freeman
Introduction to the Practice of Statistics
Statistics
ISBN:9781319013387
Author:David S. Moore, George P. McCabe, Bruce A. Craig
Publisher:W. H. Freeman