
A First Course in Probability (10th Edition)
10th Edition
ISBN: 9780134753119
Author: Sheldon Ross
Publisher: PEARSON
expand_more
expand_more
format_list_bulleted
Related questions
Question
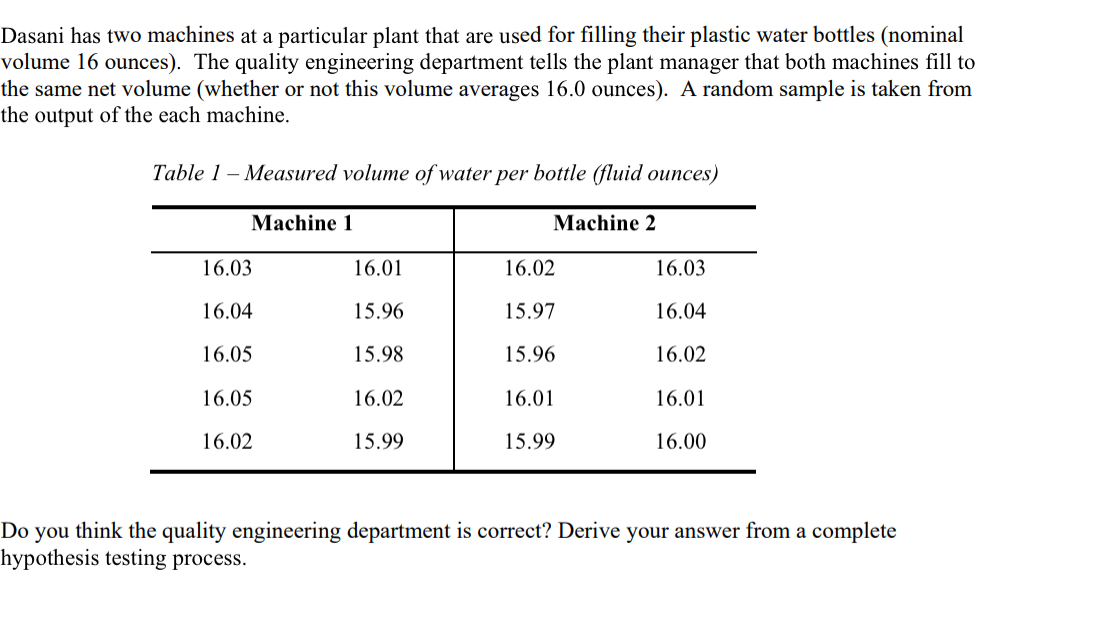

Transcribed Image Text:Dasani has two machines at a particular plant that are used for filling their plastic water bottles (nominal
volume 16 ounces). The quality engineering department tells the plant manager that both machines fill to
the same net volume (whether or not this volume averages 16.0 ounces). A random sample is taken from
the output of the each machine.
Table 1-Measured volume of water per bottle (fluid ounces)
Machine 1
Machine 2
16.03
16.01
16.02
16.03
16.04
15.96
15.97
16.04
16.05
15.98
15.96
16.02
16.05
16.02
16.01
16.01
16.02
15.99
15.99
16.00
Do you think the quality engineering department is correct? Derive your answer from a complete
hypothesis testing process.
Expert Solution
This question has been solved!
Explore an expertly crafted, step-by-step solution for a thorough understanding of key concepts.

This is a popular solution

Trending nowThis is a popular solution!

Step by stepSolved in 2 steps

Knowledge Booster

Similar questions
- To determine if their 1.50 centimeter bolts are properly adjusted, Norman & Mayer Manufacturing has decided to use an X-Chart which uses the range to estimate the variability in the sample. Table Control Chart Answer How to enter your answer (opens in r Step 1 of 7: What is the Center Line of the control chart? Round your answer to three decimal places. Period 1 2 3 4 5 6 Copy Table Tables Select the Copy Table button to copy all values. To select an entire row or column, either click on the row or column header or use the Shift and arrow keys. To find the average of the selected cells, select the Average Values button. ON obs1 obs2 1.45 1.52 1.55 1.51 1.51 1.50 1.50 1.53 1.46 1.53 1.52 1.54 1.51 1.50 1.50 1.52 1.46 1.47 1.52 1.53 1.53 1.54 1.53 1.53 1.53 1.53 1.54 1.48 1.54 1.49 1.53 1.50 7 1.46 1.46 1.54 1.48 1.49 1.51 8 1.47 1.48 1.51 1.51 1.53 1.50 9 1.50 1.54 1.54 1.53 1.53 1.49 10 1.54 1.49 1.55 1.51 1.51 1.50 Keypad Copy Table Average Values The average of the selected cell(s)…arrow_forwardJ In-shop othesis test for the difference between two population proportions 02562 2600368.qx3zqy7 Jump to level 1 The manager of a coffee shop is trying to determine if drive-through customers buy fewer items than customers who come into the shop. The manager randomly samples both populations and calculates the proportion of customers in each that buy three or more items. The results of the data collected are shown below. What are the population parameters? Y Pick Drive-through Successes 27 Successes What is the level of significance? Ex: 0.12 Observations 76 Observations 41 119 0.345 p-hat_1 0.355 p-hat_2 What is the null hypothesis Ho? Pick Confidence Level 0.1429 What is the alternative hypothesis Ha? Pick p-value Should Ho be rejected or does Ho fail to be rejected? Pick What conclusion can be drawn from the data? Pick evidence exists to support the claim that drive-through customers buy fewer items than in-shop customers. 2 p Warrow_forwardSeveral methods of estimating the number of seeds in soil samples have been developed by ecologists. An article gave the accompanying data on the number of seeds detected by the direct method and by the stratified method for 27 soil specimens. Specimen Direct Stratified 1 21 7 2 34 38 3 0 7 4 60 58 5 20 54 6 61 61 7 40 27 8 7 7 9 14 7 10 94 100 11 1 0 12 67 58 13 78 67 14 21 54 Specimen Direct Stratified 15 34 27 16 0 0 17 38 38 18 18 14 19 94 94 20 1 14 21 40 47 22 21 21 23 0 0 24 7 14 25 14 40 26 18 14 27 40 78 Do the data provide sufficient evidence to conclude that the mean number of seeds detected differs for the two methods? Test the relevant hypotheses using ? = 0.05. (Use ?direct − ?stratified.) Find the test statistic. (Round your answer to two decimal places.) t = Find the df. (Round your answer down to the nearest whole number.) df = Use technology to find the P-value. (Round your answer to four…arrow_forward
- Use R code, place the steps and screenshots of the procedure From the following data of the diameter of a particle in (μm) Calculate: Sample mean, Sample standard deviationHistogram (Frequency vs diameter), Histogram (probability density vs diameter)Curves (equation and graph) that fit the graphs and their explanation Diameter (μm) 2 2.6 1.2 1.8 0.8 2 1.4 1.4 1.4 1.8 1.4 1.4 1.4 0.6 1.2 1.2 41.4 1.4 2.4 1.4 2 2.4 1.8 1.4 2 1.8 2 1.8 0.8 2.2 2.8 2.8 4.6 2 1.4 2.4 1.2 1.4 1.2 5 1.4 1.2 2 0.8 1.4 1.8 1.2 2 1.4 1.4 1.8 2.6arrow_forwardBelow a r bivariate data sets and their scatter plots. (Note that all of the scatter plots are displayed with the same scale.) Each data set is made up of sample values drawn from a population. x y 11- 1- 1.0 1.0 1.0 7.5 10+ 9- 8- 7- 6- 10+ 2.0 8.8 8- 3.0 6.9 2.0 2.0 9- 3.0 3.0 7- 4.0 5.2 5.0 8.4 6.0 4.9 7.0 4.7 8.0 6.8 9.0 6.1 4.0 4.0 6- 5- 5- 5.0 5.0 4- 4- 6.0 6.0 3- 2 3- 7.0 7.0 2 1- 1- 8.0 8.0 9.0 9.0 10.0 10.0 Figure 1 10.0 4.2 Figure 2 1- 1.0 2.6 10- 1.0 6.7 10+ 9- 2.0 9.6 8- 3.0 3.6 2.0 4.5 9- 3.0 3.2 7- 1- 4.0 5.0 4.0 9.2 6- 6- 5- 5- 5.0 4.9 6.0 2.0 7.0 5.6 8.0 9.8 9.0 5.2 10.0 8.2 Figure 4 5.0 4.6 4- 6.0 7.0 7.0 6.0 8.0 7.7 3- 3- 2- 2- 1- 9.0 7.1 10.0 8.4 Figure 3 Answer the following questions about the relationships between pairs of variables and the values of r, the sample correlation coefficient. The same response may be the correct answer for more than one question. (a) For which data set is the sample correlation coefficient r closest to 0? ? Choose one) (b) Which data…arrow_forwardPlease answerarrow_forward
- Several methods of estimating the number of seeds in soil samples have been developed by ecologists. An article gave the accompanying data on the number of seeds detected by the direct method and by the stratified method for 27 soil specimens. Specimen Direct Stratified 1 21 6 2 32 38 3 0 6 4 60 58 5 20 52 6 61 61 7 40 26 8 6 6 9 12 6 10 92 100 11 1 0 12 66 58 13 78 66 14 21 52 Specimen Direct Stratified 15 32 26 16 0 0 17 38 38 18 18 12 19 92 92 20 1 12 21 40 46 22 21 21 23 0 0 24 6 12 25 12 40 26 18 12 27 40 78 Do the data provide sufficient evidence to conclude that the mean number of seeds detected differs for the two methods? Test the relevant hypotheses using ? = 0.05. (Use ?direct − ?stratified.) Find the test statistic. (Round your answer to two decimal places.) t = Find the df. (Round your answer down to the nearest whole number.) df = Use technology to find the P-value. (Round your answer to four…arrow_forwardAnswer and show complete solution. Pls don't rejectIn a study on the settlement of piles used in building foundations, data on the observed pile settlement were collected and compared with the calculated/estimated values. The ratio of the observed to the calculated settlements is a measure of the accuracy of the calculation method. The ratios are shown in the table below and as can be observed, it shows considerable variability: Ratios of Observed Settlement to Calculated Settlement of Piles 0.12 0.97 0.86 1.14 0.94 2.37 0.88 0.92 1.01 0.99 1.02 1.04 0.99 0.87 0.52 0.94 1.06 1.38 1.04 1.18 1 0.86 0.82 0.84 1.09 a. Assuming that the ratio is a normal random variable, construct a probability plot and observe if the data points follow a linear trend.arrow_forwardplease delete this question https://www.bartleby.com/questions-and-answers/on-average-12-balls-enters-the-room-every-minute.-what-is-the-probability-that-the-4th-ball-seconds-/bf7aa36b-4874-48db-ad82-70238fffa04barrow_forward
arrow_back_ios
arrow_forward_ios
Recommended textbooks for you
- A First Course in Probability (10th Edition)ProbabilityISBN:9780134753119Author:Sheldon RossPublisher:PEARSON

A First Course in Probability (10th Edition)
Probability
ISBN:9780134753119
Author:Sheldon Ross
Publisher:PEARSON