
MATLAB: An Introduction with Applications
6th Edition
ISBN: 9781119256830
Author: Amos Gilat
Publisher: John Wiley & Sons Inc
expand_more
expand_more
format_list_bulleted
Related questions
Question
I need help on my classwork
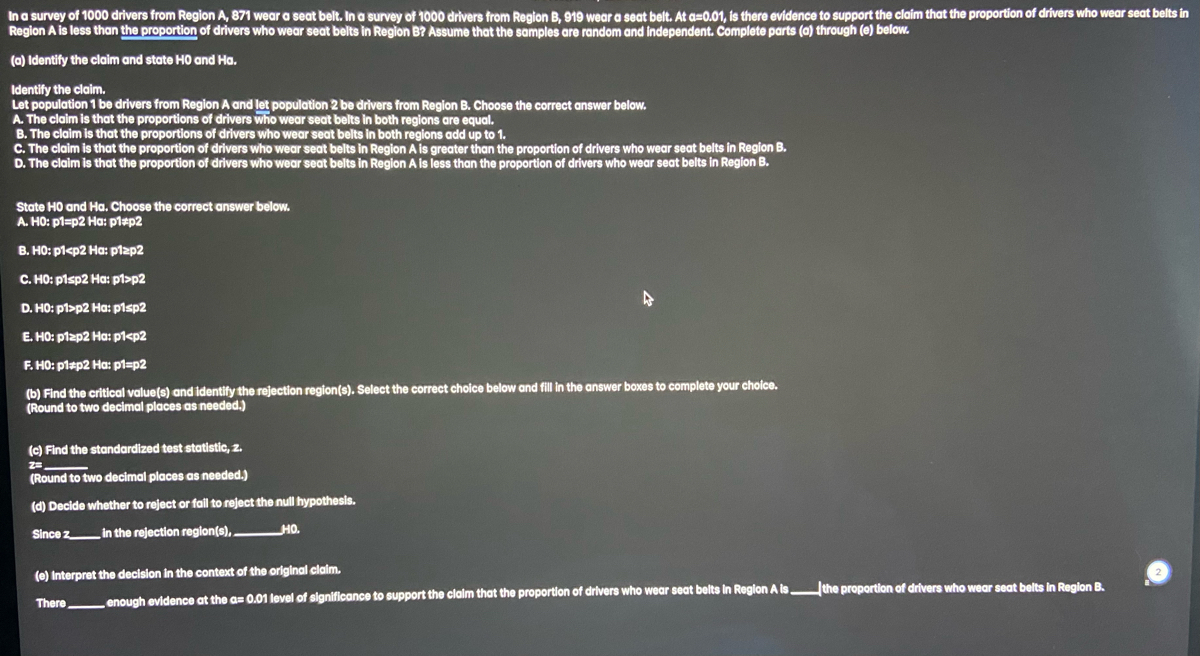

Transcribed Image Text:In a survey of 1000 drivers from Region A, 871 wear a seat belt. In a survey of 1000 drivers from Region B, 919 wear a seat belt. At a=0.01, is there evidence to support the claim that the proportion of drivers who wear seat belts in
Region A is less than the proportion of drivers who wear seat belts in Region B? Assume that the samples are random and independent. Complete parts (a) through (e) below.
(a) Identify the claim and state HO and Ha.
Identify the claim.
Let population 1 be drivers from Region A and let population 2 be drivers from Region B. Choose the correct answer below.
A. The claim is that the proportions of drivers who wear seat belts in both regions are equal.
B. The claim is that the proportions of drivers who wear seat belts in both regions add up to 1.
C. The claim is that the proportion of drivers who wear seat belts in Region A is greater than the proportion of drivers who wear seat belts in Region B.
D. The claim is that the proportion of drivers who wear seat belts in Region A is less than the proportion of drivers who wear seat belts in Region B.
State H0 and Ha. Choose the correct answer below.
A. H0: p1=p2 Ha: p1#p2
B. HO: p1<p2 Ha: p1zp2
C. HO: p1sp2 Ha: p1>p2
D. HO: p1>p2 Ha: p1sp2
E. HO: p1ap2 Ha: p1<p2
F. H0: p1#p2 Ha: p1=p2
(b) Find the critical value(s) and identify the rejection region(s). Select the correct choice below and fill in the answer boxes to complete your choice.
(Round to two decimal places as needed.)
(c) Find the standardized test statistic, z.
Z=
(Round to two decimal places as needed.)
(d) Decide whether to reject or fail to reject the null hypothesis.
Since z in the rejection region(s),
HO.
4
(e) Interpret the decision in the context of the original claim.
There enough evidence at the a= 0.01 level of significance to support the claim that the proportion of drivers who wear seat belts in Region A is the proportion of drivers who wear seat belts in Region B.
Expert Solution
This question has been solved!
Explore an expertly crafted, step-by-step solution for a thorough understanding of key concepts.

Step by stepSolved in 6 steps with 17 images

Knowledge Booster

Similar questions
arrow_back_ios
arrow_forward_ios
Recommended textbooks for you
- MATLAB: An Introduction with ApplicationsStatisticsISBN:9781119256830Author:Amos GilatPublisher:John Wiley & Sons Inc
 Probability and Statistics for Engineering and th...StatisticsISBN:9781305251809Author:Jay L. DevorePublisher:Cengage Learning
 Statistics for The Behavioral Sciences (MindTap C...StatisticsISBN:9781305504912Author:Frederick J Gravetter, Larry B. WallnauPublisher:Cengage Learning
  Elementary Statistics: Picturing the World (7th E...StatisticsISBN:9780134683416Author:Ron Larson, Betsy FarberPublisher:PEARSON
 The Basic Practice of StatisticsStatisticsISBN:9781319042578Author:David S. Moore, William I. Notz, Michael A. FlignerPublisher:W. H. Freeman
 Introduction to the Practice of StatisticsStatisticsISBN:9781319013387Author:David S. Moore, George P. McCabe, Bruce A. CraigPublisher:W. H. Freeman
MATLAB: An Introduction with Applications
Statistics
ISBN:9781119256830
Author:Amos Gilat
Publisher:John Wiley & Sons Inc
Probability and Statistics for Engineering and th...
Statistics
ISBN:9781305251809
Author:Jay L. Devore
Publisher:Cengage Learning
Statistics for The Behavioral Sciences (MindTap C...
Statistics
ISBN:9781305504912
Author:Frederick J Gravetter, Larry B. Wallnau
Publisher:Cengage Learning
Elementary Statistics: Picturing the World (7th E...
Statistics
ISBN:9780134683416
Author:Ron Larson, Betsy Farber
Publisher:PEARSON
The Basic Practice of Statistics
Statistics
ISBN:9781319042578
Author:David S. Moore, William I. Notz, Michael A. Fligner
Publisher:W. H. Freeman
Introduction to the Practice of Statistics
Statistics
ISBN:9781319013387
Author:David S. Moore, George P. McCabe, Bruce A. Craig
Publisher:W. H. Freeman