
Essentials of Business Analytics (MindTap Course List)
2nd Edition
ISBN: 9781305627734
Author: Jeffrey D. Camm, James J. Cochran, Michael J. Fry, Jeffrey W. Ohlmann, David R. Anderson
Publisher: Cengage Learning
expand_more
expand_more
format_list_bulleted
Related questions
Question
All answers must be entered as a formula only. Please reference the correct cell(s) or the cell(s) value.

Transcribed Image Text:FILE
HOME
INSERT
Paste
Clipboard
-
Calibri
BIU-
Font
11
A1
A B
1
2
3
10
456789
11
PAGE LAYOUT
-
v
x
fx
C
Г
Using probability distributions - Excel
2
FORMULAS
DATA
REVIEW
VIEW
%
ㄓ
Alignment Number
Conditional Format as
Formatting Table
Cell
Styles™
Cells
Editing
Styles
Th
Sign In
D
E
F
G
H
I
J
K
x
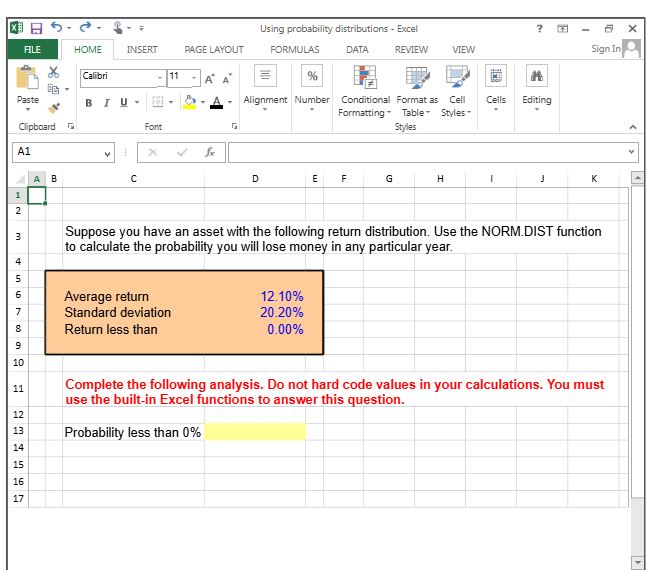
Suppose you have an asset with the following return distribution. Use the NORM.DIST function
to calculate the probability you will lose money in any particular year.
Average return
Standard deviation
Return less than
12.10%
20.20%
0.00%
Complete the following analysis. Do not hard code values in your calculations. You must
use the built-in Excel functions to answer this question.
15
16
17
25
12
13
Probability less than 0%
14
Expert Solution
This question has been solved!
Explore an expertly crafted, step-by-step solution for a thorough understanding of key concepts.

Step by stepSolved in 2 steps with 2 images

Knowledge Booster

Similar questions
- help please answer in text form with proper workings and explanation for each and every part and steps with concept and introduction no AI no copy paste remember answer must be in proper format with all workingarrow_forwardq5- In which of the following charts the X-axis represents outcomes and the Y-axis represents the number of times or the percentage each outcome occurs in the dataset? a. A combo-chart b. A scatter plot c. A histogram d. A boxplotarrow_forwardNo chatgpt used i will give 5 upvotes typing please i need both answersarrow_forward
- Only typed solutionarrow_forwardQuestion 2 Listen Which linear regression equation matches the given data sets? Use your TI-84+ calculator to determine the equations. Hint: Click STAT and chose option 1: EDIT. Enter your data into L1 (explanatory variable) and L2 (response variable). Click STAT, choose CALC, and choose op- tion 8. Table A x y X Table B y 0 7.5 0 6.8 1 7.7 1 5 2 8 2 7.5 3 8 3 7 4 8.5 4 9 Table C Table D X y X y 0 11.2 0 15 1 7.7 1 77 2 8 NOT AN OPTION 3 4.5 3 6.5 4 4.6 4 3.2 ŷ=7.48+0.23x a. Table B ŷ-5.78+0.64x b. Table C y=10.48-1.64x c. Table Aarrow_forwardGlasgow Corporation has the following inventory transactions during the year. Unit Number of Units 53 133 Cost $ 45 47 Total Cost $ 2,385 6,251 10,150 5,763 Date Transaction Jan. 1 Beginning inventory Purchase Purchase Purchase Apr. 7 Jul.16 203 50 Oct. 6 113 51 502 $24,549 For the entire year, the company sells 433 units of inventory for $63 each.arrow_forward
arrow_back_ios
SEE MORE QUESTIONS
arrow_forward_ios
Recommended textbooks for you
- Essentials of Business Analytics (MindTap Course ...StatisticsISBN:9781305627734Author:Jeffrey D. Camm, James J. Cochran, Michael J. Fry, Jeffrey W. Ohlmann, David R. AndersonPublisher:Cengage Learning
 Survey of Accounting (Accounting I)AccountingISBN:9781305961883Author:Carl WarrenPublisher:Cengage Learning
Essentials of Business Analytics (MindTap Course ...
Statistics
ISBN:9781305627734
Author:Jeffrey D. Camm, James J. Cochran, Michael J. Fry, Jeffrey W. Ohlmann, David R. Anderson
Publisher:Cengage Learning
Survey of Accounting (Accounting I)
Accounting
ISBN:9781305961883
Author:Carl Warren
Publisher:Cengage Learning