
ENGR.ECONOMIC ANALYSIS
14th Edition
ISBN: 9780190931919
Author: NEWNAN
Publisher: Oxford University Press
expand_more
expand_more
format_list_bulleted
Related questions
Question

Transcribed Image Text:DS
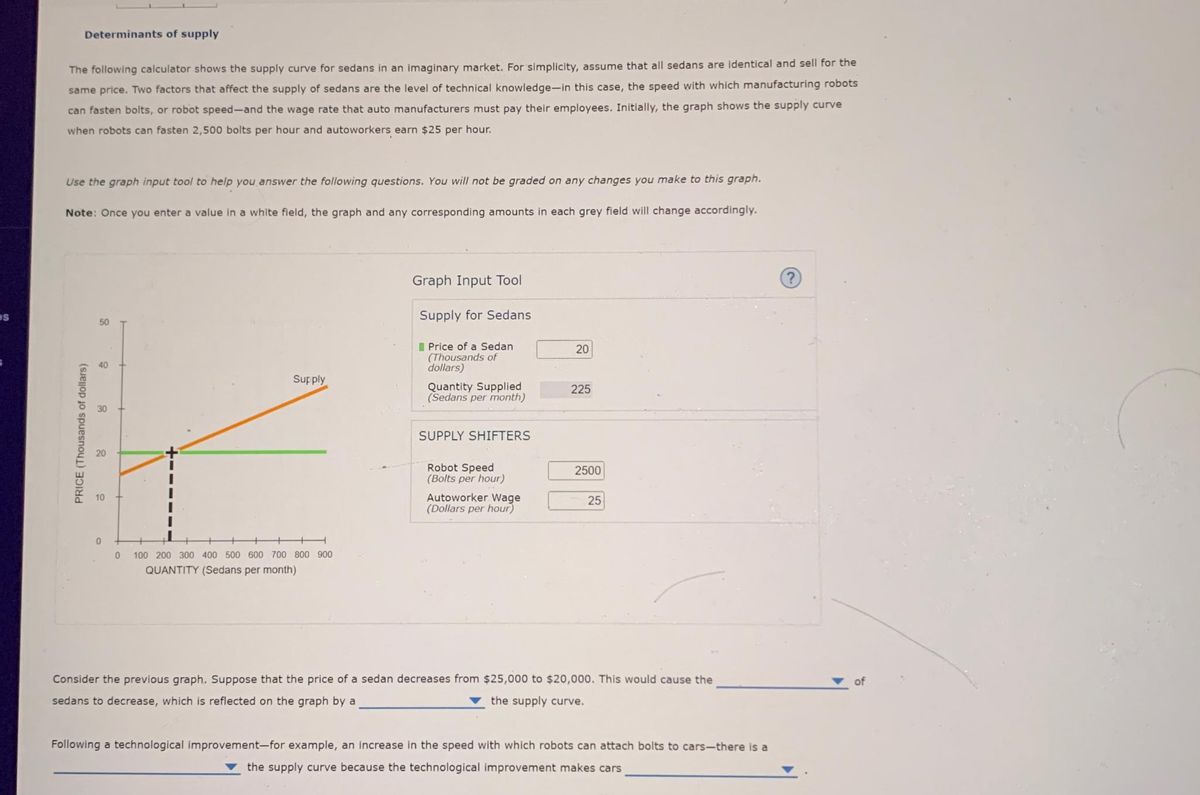
Determinants of supply
The following calculator shows the supply curve for sedans in an imaginary market. For simplicity, assume that all sedans are identical and sell for the
same price. Two factors that affect the supply of sedans are the level of technical knowledge-in this case, the speed with which manufacturing robots
can fasten bolts, or robot speed-and the wage rate that auto manufacturers must pay their employees. Initially, the graph shows the supply curve
when robots can fasten 2,500 bolts per hour and autoworkers earn $25 per hour.
Use the graph input tool to help you answer the following questions. You will not be graded on any changes you make to this graph.
Note: Once you enter a value in a white field, the graph and any corresponding amounts in each grey field will change accordingly.
PRICE (Thousands of dollars)
8
20
10
0
0
Supply
100 200 300 400 500 600 700 800 900
QUANTITY (Sedans per month)
Graph Input Tool
Supply for Sedans
Price of a Sedan
(Thousands of
dollars)
Quantity Supplied
(Sedans per month)
SUPPLY SHIFTERS
Robot Speed
(Bolts per hour)
Autoworker Wage
(Dollars per hour)
20
225
2500
25
Consider the previous graph. Suppose that the price of a sedan decreases from $25,000 to $20,000. This would cause the
sedans to decrease, which is reflected on the graph by a
the supply curve.
Following a technological improvement-for example, an increase in the speed with which robots can attach bolts to cars-there is a
the supply curve because the technological improvement makes cars
of
Expert Solution
This question has been solved!
Explore an expertly crafted, step-by-step solution for a thorough understanding of key concepts.

This is a popular solution

Trending nowThis is a popular solution!

Step by stepSolved in 4 steps with 2 images

Knowledge Booster


Learn more about
Need a deep-dive on the concept behind this application? Look no further. Learn more about this topic, economics and related others by exploring similar questions and additional content below.Similar questions
- Question 1 Consider a rice farmer planting two (2) types of rice, white and brown rice, concurrently in his rice field using the same resources and technology and harvesting them at the same time. Given that consumers like to mix both white and brown rice in their daily consumption, explain the effect on the white rice market when the price of brown rice increases. Support your answers with suitable white rice market diagrams. Consider a farmer that produces both white and brown rice. It is discovered that the demand for brown rice is relatively more inelastic compared to the demand for white rice. Initially the price of both white and brown rice is the same and the farmer produces the same quantity of white and brown rice. Now there is an improvement in agricultural technologies that affect both white and brown rice equally. Employ the demand and supply model to compare and contrast the effects on the equilibrium price and quantity of both white and brown rice…arrow_forwardConsider two markets: the market for waffles and the market for pancakes. The initial equilibrium for both markets is the same, the equilibrium price is $6.50, and the equilibrium quantity is 35.0. When the price is $9.75, the quantity supplied of waffles is 57.0 and the quantity supplied of pancakes is 101.0. For simplicity of analysis, the demand for both goods is the same. Using the midpoint formula, calculate the elasticity of supply for pancakes. Please round to two decimal places. Supply in the market for waffles isarrow_forwardIndicate whether each of the following situations would shift the supply curve of hand sanitizers to the left, to the right, or not at all. An increase in the number of firms in the market An increase in the current price of the hand sanitizers A decrease in productivity of labor An increase in the expected future price of a product A decrease in the price of crude oil.arrow_forward
- 17. University admissions Suppose the following graph shows the supply of and demand for admission to the University of British Columbia, where supply represents the number of student openings and demand represents the number of students who want to attend UBC (that is, the number of student applications) at any given level of tuition. Use the graph to help you answer the questions that follow. Note: Select and drag one or both of the curves to the desired position. Curves will snap into position, so if you try to move a curve and it snaps back to its original position, just drag it a little farther. Admission to the University of British Columbia 60 Supply 50 Demand 40 Supply 30 20 Demand 10 2 4 10 12 NUMBER OF STUDENTS (Thousands) The equilibrium level of tuition at UBC is s per academic year. If UBC sets its tuition at this price, the number of openings available will TUITION (Thousands of dollars)arrow_forwardExplain in grapharrow_forward4:33 ◄ Search .5G 8+ 1) You are the admissions director at a college. You know there is high demand for your product. However, you only have space for a certain number of students. USE Some of the KEY TERMS listed to explain why you would (or would not) increase the price of attendance. 2) You are the admission director at a College. How do you convince graduating high school seniors to attend your college, instead of the University of Georgia. USE the KEY TERMS in the chapter. KEY TERMS are opportunity cost, budget constraint, comparative advantage, marginal analysis, opportunity set, positive statement, utility, allocative efficiency, invisible hand.arrow_forward
- Last year, a man shared a video on TikTok of himself longboarding to work while drinking a bottle of OceanSpray juice. This resonated with the online community and kicked off a challenge to reproduce the scene using the same drink. Use the Four-Step method and draw a supply/demand graph to predict the effect on equilibrium price and quantity for OceanSpray. Clearly label your graph and upload it to the dropbox labeled (you may draw it on paper and take a picture, or use some other software).arrow_forwardhello please help mearrow_forwardQ3. Assume that the demand curve D(p) given below is the market demand for widgets:Q=D(p)=2372−19p, p > 0 Let the market supply of widgets be given by:Q=S(p)=−3+6p, p > 0 where p is the price and Q is the quantity. The functions D(p) and S(p) give the number of widgets demanded and supplied at a given price.What is the equilibrium price? Please round your answer to the nearest hundredth.What is the equilibrium quantity? Please round your answer to the nearest integer.What is the price elasticity of demand (include negative sign if negative)? Please round your answer to the nearest hundredth.What is the price elasticity of supply? Please round your answer to the nearest hundredtharrow_forward
- Looking for help on how you would go about solving the following problem: The following functions represent the demand and supply for hair cuts. QD=300-6P QS=2P-20 what demand function would accurately represent an increase in demand for hair cuts? QS=450-6P QD =150-6P QD =450-5P QD =450-6Parrow_forwardThe weekly demand for wine in the United States is described by the following equation: Qd = 45,000,000 - 1,500,000P where Qd is the weekly quatity demanded in bottles and P is the price per bottle in dollars. The weekly supply of wine in the United States is described by the following equation: Qs = -5,000,000 + 1,000,000P where Qs is the weekly quantity supplied in bottles and P is the price per bottle in dollars. a. What is the equilibrium price and quantity for wine in the US? Intense lobbying efforts result in the United States government establishing a $5 per bottle excise tax by wine producers. b. What would be the new equilibirum price and quantity after the imposition of the per bottle excise tax? c. Determine the total amount of the consumer surplus assuming the market for wine is in equilibrium after the imposition of the excise tax.arrow_forwardfor the below table, can you provide the supply function and list out the different variables and constants for it?arrow_forward
arrow_back_ios
SEE MORE QUESTIONS
arrow_forward_ios
Recommended textbooks for you
 Principles of Economics (12th Edition)EconomicsISBN:9780134078779Author:Karl E. Case, Ray C. Fair, Sharon E. OsterPublisher:PEARSON
 Engineering Economy (17th Edition)EconomicsISBN:9780134870069Author:William G. Sullivan, Elin M. Wicks, C. Patrick KoellingPublisher:PEARSON
 Principles of Economics (MindTap Course List)EconomicsISBN:9781305585126Author:N. Gregory MankiwPublisher:Cengage Learning
 Managerial Economics: A Problem Solving ApproachEconomicsISBN:9781337106665Author:Luke M. Froeb, Brian T. McCann, Michael R. Ward, Mike ShorPublisher:Cengage Learning
 Managerial Economics & Business Strategy (Mcgraw-...EconomicsISBN:9781259290619Author:Michael Baye, Jeff PrincePublisher:McGraw-Hill Education
Principles of Economics (12th Edition)
Economics
ISBN:9780134078779
Author:Karl E. Case, Ray C. Fair, Sharon E. Oster
Publisher:PEARSON
Engineering Economy (17th Edition)
Economics
ISBN:9780134870069
Author:William G. Sullivan, Elin M. Wicks, C. Patrick Koelling
Publisher:PEARSON
Principles of Economics (MindTap Course List)
Economics
ISBN:9781305585126
Author:N. Gregory Mankiw
Publisher:Cengage Learning
Managerial Economics: A Problem Solving Approach
Economics
ISBN:9781337106665
Author:Luke M. Froeb, Brian T. McCann, Michael R. Ward, Mike Shor
Publisher:Cengage Learning
Managerial Economics & Business Strategy (Mcgraw-...
Economics
ISBN:9781259290619
Author:Michael Baye, Jeff Prince
Publisher:McGraw-Hill Education