ENGR.ECONOMIC ANALYSIS
14th Edition
ISBN: 9780190931919
Author: NEWNAN
Publisher: Oxford University Press
expand_more
expand_more
format_list_bulleted
Question
thumb_up100%
Consider the economy of Russia, which produces oil and cars that are sold both domestically and internationally. Suppose an increase in foreign income causes an increase in the world demand for oil, whereas the supply does not change.
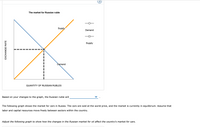
The following graph shows the market for oil in Russia.
Adjust the following graph to show the effect of a higher demand for oil on the economy of Russia.
Note: Select and drag one or both of the curves to the desired position. Curves will snap into position, so if you try to move a curve and it snaps back to its original position, just drag it a little farther.

Transcribed Image Text:The market for Russian ruble
Supply
Demand
Supply
Demand
QUANTITY OF RUSSIAN RUBLES
Based on your changes to the graph, the Russian ruble will
The following graph shows the market for cars in Russia. The cars are sold at the world price, and the market is currently in equilibrium. Assume that
labor and capital resources move freely between sectors within the country.
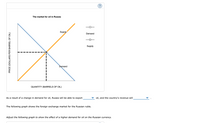
Adjust the following graph to show how the changes in the Russian market for oil affect the country's market for cars.
EXCHANGE RATE

Transcribed Image Text:(?
The market for oil in Russia
Supply
Demand
Supply
Demand
QUANTITY (BARRELS OF OIL)
As a result of a change in demand for oil, Russia will be able to export
oil, and the country's revenue will
The following graph shows the foreign exchange market for the Russian ruble.
Adjust the following graph to show the effect of a higher demand for oil on the Russian currency.
PRICE (DOLLARS PER BARREL OF OIL)
Expert Solution
This question has been solved!
Explore an expertly crafted, step-by-step solution for a thorough understanding of key concepts.
This is a popular solution
Trending nowThis is a popular solution!
Step by stepSolved in 3 steps with 2 images

Knowledge Booster
Learn more about
Need a deep-dive on the concept behind this application? Look no further. Learn more about this topic, economics and related others by exploring similar questions and additional content below.Similar questions
- Construct a graph (diagram) for this question without an explanation. What will happen to the equilibrium price and quantity of coffee if it is discovered that coffee helps to prevent colds and, at the same time, Brazil and Vietnam emerge in the global market as massive producers of coffee? Assume the responsiveness of supply is greater than the responsiveness of demandarrow_forwardSuppose both the demand for olives and the supply of olives decline by equal amounts over some time period. Use graphical analysis to show the effect on equilibrium price and quantity. Instructions: On the graph below, use your mouse to click and drag the supply and demand curves as necessary. D1 Quantity of olives Price of olivesarrow_forwardCalculate equilibrium price and equilibrium quantity and fill the following column Qd = 1,400 – 10P Os = -400 + 20P Os2 = -400 – 10P Os3 = -400 – 15P e. Table – 3 Šupply = 1,400 – 10P -400 + 20P Supply2 = -400 + 10P Supply3 = 400 + 30P Price Demand = 0. 20 40 60 80 100 120 140 160 Draw the three supple functions and one demand curves according to the estimation in the table-3 and point out equilibrium levels f. 160 140 120 100 80 60 40 20 600 700 800 900 1000 1100 1200 400 500arrow_forward
- Question 1 Consider a rice farmer planting two (2) types of rice, white and brown rice, concurrently in his rice field using the same resources and technology and harvesting them at the same time. Given that consumers like to mix both white and brown rice in their daily consumption, explain the effect on the white rice market when the price of brown rice increases. Support your answers with suitable white rice market diagrams. Consider a farmer that produces both white and brown rice. It is discovered that the demand for brown rice is relatively more inelastic compared to the demand for white rice. Initially the price of both white and brown rice is the same and the farmer produces the same quantity of white and brown rice. Now there is an improvement in agricultural technologies that affect both white and brown rice equally. Employ the demand and supply model to compare and contrast the effects on the equilibrium price and quantity of both white and brown rice…arrow_forwardPrice si S2 C D2 D1 Quantity Which of the following would result in equilibrium shifting from point C to point A?arrow_forwardAssume the demand curve for Pepsi passes through the following two points. Price per bottle of Pepsi $2.25 $1.75 Number of bottles of Pepsi sold 100,000 275,000 When plotting the demand curve (with price in dollars on the y-axis and quantity in bottles on the x-axis), when the y-value is $2.25, the x-value is the y-value is $1.75, the x-value is bottles. (Enter your responses as whole numbers.) bottles, and whenarrow_forward
- Please give a detailed solution with an explanation. Please make sure the graph is visible, clear, and detailed. Make sure to include the new equilibrium coordinate point as well.arrow_forwardThis problem involves solving demand and supply equations together to determine price and quantity. a. Consider a demand curve of the form QD=-2P+20, where QD is the quantity demanded of a good and P is the price of the good. Graph this demand curve. Also draw a graph of the supply curve Qs =2P-4, where Qs is the quantity supplied. Be sure to put P on the vertical axis and Q on the horizontal axis. Assume that all the Qs and Ps are nonnegative for parts a, b, and c. At what values of P and Q do these curves intersect-that is, where does QD = Qs ? b. Now, suppose at each price that individuals demand four more units of output-that the demand curve shifts to QD - 2P+24. Graph this new demand curve. At what values of P and Q does the new demand curve intersect the old supply curve-that is, where does QD = Qs ? c. Now finally, suppose the supply curve shifts to Q's=2P-8. Graph this new supply curve. At what values of P and Q does QD=Q's? Show all working calculations and label garph with…arrow_forwardPlease give a detailed solution with an explanation. PLease make sure the graph is visible, clear, and detailed. Make sure to include the new equilibrium coordinate point as well.For the 2 blank answers here are the options:Blank Answer #1:decrease or increasearrow_forward
- The demand for Good X in New Bedford, MA is given by the following equation: Qd=60-40P+2I-30Py where: Qd is the quantity demanded of Good X P is the price of Good X I is income Pb is the price of Good Y Without performing any calculations, determine if Good X and Good Y are substitutes, complements, or unrelated goods. Explain how you used the function to make this determination. Without performing any calculations, determine if Good X is a normal or inferior good. Explain how you used the function to make this determination. On a clearly labeled graph, plot the demand curve assuming the price of Good Y is $6 and income is $700arrow_forwardYou are a financial analyst with a specialization in the motion pictureIndustry. You have been hired to analyze the prices of movie theater tickets. The following two events are occurring simultaneously in the Ghana:A new national chain opens new multi-screen movie theaters in most cities in Ghana.Movie theaters cut the price of popcorn and soft drinks in half.Draw a demand-and-supply graph showing equilibrium in the market for movie tickets hefore the above two events took place. Label the axes and curves. Label the initial equilibrium — before events (i) and (ii) - as P,and Q, on your graph.b.Now show on your graph how event (i) affects the demand or supply curves for tone teres, Brelly explain which of the demand or supply variables caused the eftect you are showing on your graph.Now slow on your graph how event (il) affects the demand or supply curves for ovis Lesets. Brielly explain which of the demand or supply variables caused the effe you are showing on your graph.Based on your…arrow_forwardThe market price of pizzas in a college town decreased recently, and the students in an economics class are debating the cause of the price decrease. Some students suggest that the price decreased because several new pizza parlors have recently opened in the area. Other students attribute the decrease in the price of pizzas to a recent decrease in the price of hamburgers at local burger joints. Everyone agrees that the decrease in the price of hamburgers was caused by a recent decrease in the price of ground beef, which is not generally used in making pizzas. Assume that pizza parlors and burger joints are entirely separate entities-that is, there aren't places that serve both pizzas and hamburgers. The first group of students thinks the decrease in the price of pizzas is due to the fact that several new pizza parlors have recently opened in the area. On the following graph, adjust the supply and demand curves to illustrate the first group's explanation for the decrease in the price of…arrow_forward
arrow_back_ios
SEE MORE QUESTIONS
arrow_forward_ios
Recommended textbooks for you

 Principles of Economics (12th Edition)EconomicsISBN:9780134078779Author:Karl E. Case, Ray C. Fair, Sharon E. OsterPublisher:PEARSON
 Engineering Economy (17th Edition)EconomicsISBN:9780134870069Author:William G. Sullivan, Elin M. Wicks, C. Patrick KoellingPublisher:PEARSON
 Principles of Economics (MindTap Course List)EconomicsISBN:9781305585126Author:N. Gregory MankiwPublisher:Cengage Learning
 Managerial Economics: A Problem Solving ApproachEconomicsISBN:9781337106665Author:Luke M. Froeb, Brian T. McCann, Michael R. Ward, Mike ShorPublisher:Cengage Learning
 Managerial Economics & Business Strategy (Mcgraw-...EconomicsISBN:9781259290619Author:Michael Baye, Jeff PrincePublisher:McGraw-Hill Education


Principles of Economics (12th Edition)
Economics
ISBN:9780134078779
Author:Karl E. Case, Ray C. Fair, Sharon E. Oster
Publisher:PEARSON

Engineering Economy (17th Edition)
Economics
ISBN:9780134870069
Author:William G. Sullivan, Elin M. Wicks, C. Patrick Koelling
Publisher:PEARSON

Principles of Economics (MindTap Course List)
Economics
ISBN:9781305585126
Author:N. Gregory Mankiw
Publisher:Cengage Learning

Managerial Economics: A Problem Solving Approach
Economics
ISBN:9781337106665
Author:Luke M. Froeb, Brian T. McCann, Michael R. Ward, Mike Shor
Publisher:Cengage Learning

Managerial Economics & Business Strategy (Mcgraw-...
Economics
ISBN:9781259290619
Author:Michael Baye, Jeff Prince
Publisher:McGraw-Hill Education