
MATLAB: An Introduction with Applications
6th Edition
ISBN: 9781119256830
Author: Amos Gilat
Publisher: John Wiley & Sons Inc
expand_more
expand_more
format_list_bulleted
Related questions
Question
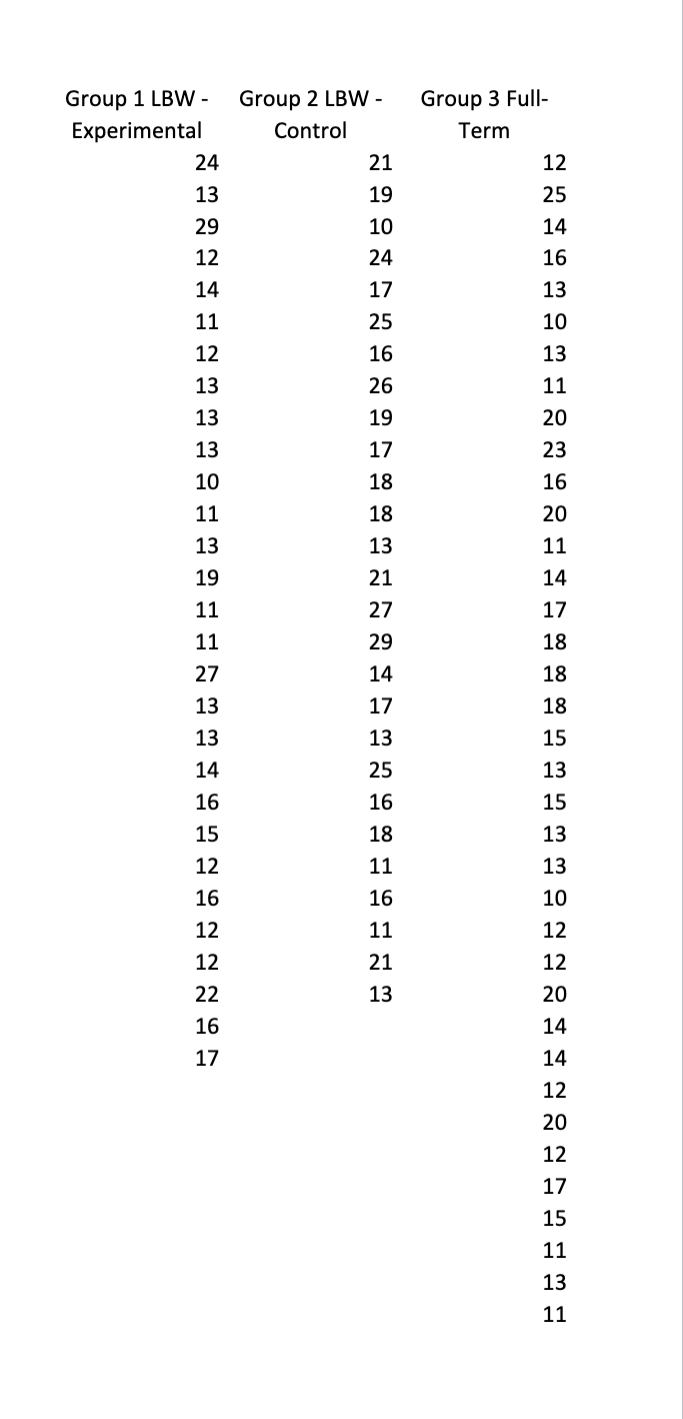

Transcribed Image Text:Group 1 LBW - Group 2 LBW -
Experimental
Control
24
21
13
19
29
10
12
24
14
17
11
25
12
16
13
26
13
19
13
17
10
18
11
18
13
13
19
21
11
27
11
29
14
17
13
25
16
18
11
16
11
21
13
16
27
13
13
14
16
15
12
16
12
12
22
16
17
Group 3 Full-
Term
12
25
14
16
13
10
13
11
20
23
16
20
11
14
17
18
18
18
15
13
15
13
13
10
12
12
20
14
14
12
20
12
17
15
11
13
11

Transcribed Image Text:Assignment 10
In a study of the development of low birth weight (LBW) infants, newborns were placed into
three groups determined by their mother's participation in a special training program about the
special needs of low birth weight infants. The mothers were interviewed when the babies were
6 months old to analyze how well they were adapting to their role as a mother.
The three groups are:
1. LBW - Experimental; this group of mothers had babies with low birth weights and
participated in the special training program
2. LBW-Control; this group of mothers had babies with low birth weights and did not
participate in the special training program
3.
Full term - Control; this group of mothers had babies born at full term with an
average birth weight and did not participate in the special training program
The experiment hoped to show that mothers who had participated in the special training
program would adapt to their new role as well as the mothers of full-term infants. The
experiment expected that mothers with low birth weight infants who did not participate in the
training would have more trouble adapting.
The data from this training is in the attached file labeled "Assignment 10 Data". This data and
this scenario are taken from:
Howell, D. C. (2014). Fundamental Statistics for the Behavioral Sciences. Cengage Learning.
1. Run an ANOVA using this data set. Upload an image of your output. (You will probably
need to take two screenshots, one for the Description and ANOVA tables and a second for
the Tukey HSD tables.
2. What is the confidence interval for the LBW - Control group, and what does it represent?
3. What is the decision for the null hypothesis?
4. What type of error (Type I or Type II) do you risk incurring with the decision that you made
in #3?
5. What is the eta-squared value, and what does it mean/how do you interpret it?
6.
7.
In the post hoc tests (the Tukey HSD), which individual groups had significant differences?
What is the Cohen's d effect size between the Group 1 LBW - Experimental and Group 2
LBW - Control group, and what does it mean/how do you interpret it?
Expert Solution
This question has been solved!
Explore an expertly crafted, step-by-step solution for a thorough understanding of key concepts.

This is a popular solution

Trending nowThis is a popular solution!

Step by stepSolved in 3 steps with 2 images

Follow-up Questions
Read through expert solutions to related follow-up questions below.
Follow-up Question
What type of error (Type I or Type II) do you risk incurring with the decision that you made in #3?
Solution
by Bartleby Expert
Follow-up Questions
Read through expert solutions to related follow-up questions below.
Follow-up Question
What type of error (Type I or Type II) do you risk incurring with the decision that you made in #3?
Solution
by Bartleby Expert
Knowledge Booster

Similar questions
- Does the new training program appear to be more effective than the older training program in lowering the weight of its new prospects?arrow_forwardA marketing organization wishes to study the effects of four sales methods (Method 1, 2, 3, & 4) on weekly sales of a product. The organization employs three salesmen (A, B, & C) to use each sales method. The weekly sales made by each salesman using four different methods are shown in the table below. Sales Method/S A B C 1 32 29 30 2 32 30 28 3 28 25 23 4 25 24 23 Run the ANOVA at 0.05 level of significance based on the provided data. Copy the Excel output below. Based on the output, test the null hypothesis H0that no differences exist between the effects of the sales methods (treatments) on mean weekly sales. Can we conclude that the different sales methods have different effects on mean weekly sales?arrow_forwardHurricane damage: In August and September 2005, Hurricanes Katrina and Rita caused extraordinary flooding in New Orleans, Louisiana. Many homes were severely damaged or destroyed, and of those that survived, many required extensive cleaning. It was thought that cleaning of flood-damaged homes might present a health hazard due to the large amounts of mold present in many of the homes. In a sample of 364 residents of Orleans Parish who had participated in cleaning of one or more homes, 72 had experienced symptoms of wheezing, and in a sample of 184 residents who had not participated in cleaning, 23 reported wheezing symptoms (numbers read from a graph). Can you conclude that the proportion of residents with wheezing symptoms is greater among those who participated in the cleaning of flood-damaged homes? Let p, denote the proportion of residents with wheezing symptoms who had cleaned flood-damaged homes, and let p, be the population proportion with wheezing symptoms who did not…arrow_forward
- You are a researcher who wants to study how people’s feelings towards Congress change over time. You send a survey to the same 1,000 people at two time points: 2005 and 2015. What type of study is this? A. Open-ended response study B. Focus group study C. Two-wave panel study D. Three-wave panel studyarrow_forward3arrow_forwardneed solutionarrow_forward
- 2. A researcher conducts a study examining the effectiveness of a group exercise program at an assisted living facility for elderly adults. One group of residents is selected to participate in the program, and a second group serves as a control. After 6 weeks, the researcher records a combined score measuring balance and strength for each individual. The data are as follows: Control n = 10 M = 12 SS = 120.5 Exercise n = 15 M = 15.5 SS = 190.0 Conduct the four steps for hypothesis testing and label a. Use a two-tailed test with a = .05. each step: Step1, Step 2, Step 3, and Step 4. b. Calculate Cohen's d. c. Are the data sufficient to conclude that thier is a significant difference? Write your answer in the form of a sentence.arrow_forwardEnvironmental Health An important issue in assessing nuclear energy is whether excess disease risks exist in the communities surrounding nuclear-power plants. A study undertaken in the community surrounding Hanford, Washington, looked at the prevalence of selected congenital malformations in the counties surrounding the nuclear-test facility.t You may need to use the appropriate technology to answer this question. (a) Suppose 28 cases of Down's syndrome are found and only 19 are expected based on Birth Defects Monitoring Program prevalence estimates in the states of Washington, Idaho, and Oregon. Are there significant excess cases in the area around the nuclear-power plant? (Round your answer to four decimal places.) There ---Select--- v a significant excess of Down's syndrome cases in the area, since the probability of observing at least 28 cases is which is ---Select--- Suppose 11 cases of cleft palate are observed, whereas only 7 are expected based on Birth Defects Monitoring…arrow_forwardA study prospectively examined whether sleep-disordered breathing was associated with an increased risk of death from any cause in a cohort of 600 adults participating in the Sleep Heart Health Study. Study participants were classified into four groups depending on the extent of their sleep-disordered breathing (none, mild, moderate, or severe). The counts of deaths over the course of the study are reported for each group in the following two-way table. Mild Severe 100 Death No Death Total None 40 100 140 40 100 140 Moderate 20 100 120 Total 200 400 600 100 200 We want to know whether the study findings give evidence of a significant difference of the number of deaths between the different groups. Set up the alternative hypothesis (H, : The distribution of the categorical variable is not as given by the null hypothesis (lack of fit) At least ones of the means is different from the others O The two categorical variables are dependent The distribution of the categorical variable is not…arrow_forward
- A study prospectively examined whether sleep-disordered breathing was associated with an increased risk of death from any cause in a cohort of 600 adults participating in the Sleep Heart Health Study. Study participants were classified into four groups depending on the extent of their sleep-disordered breathing (none, mild, moderate, or severe). The counts of deaths over the course of the study are reported for each group in the following two-way table. Death No Death Total None 40 100 140 Mild 40 100 140 Moderate 20 100 120 Severe 100 100 200 Total 200 400 600 We want to know whether the study findings give evidence of a significant difference of the number of deaths between the different groups. The observed test statistic is 3.610 42.857 5.476 8.075arrow_forwardPenicillin Yields. In Statistics for Experimenters (New York, NY: John Wiley &Sons, Inc., 1978),G. Box, W. Hunter, and J. Hunter describe an experiment to determine the effect on yield of four variants of a process for producing penicillin. A basic material in the production process, corn steep liquor, was known to be quite variable. Five blends of corn steep liquor were obtained, and each blend was divided into four equal parts. The four process variants were randomly assigned to the four parts in each blend. The penicillin yields are given in the following table.arrow_forward
arrow_back_ios
arrow_forward_ios
Recommended textbooks for you
- MATLAB: An Introduction with ApplicationsStatisticsISBN:9781119256830Author:Amos GilatPublisher:John Wiley & Sons Inc
 Probability and Statistics for Engineering and th...StatisticsISBN:9781305251809Author:Jay L. DevorePublisher:Cengage Learning
 Statistics for The Behavioral Sciences (MindTap C...StatisticsISBN:9781305504912Author:Frederick J Gravetter, Larry B. WallnauPublisher:Cengage Learning
  Elementary Statistics: Picturing the World (7th E...StatisticsISBN:9780134683416Author:Ron Larson, Betsy FarberPublisher:PEARSON
 The Basic Practice of StatisticsStatisticsISBN:9781319042578Author:David S. Moore, William I. Notz, Michael A. FlignerPublisher:W. H. Freeman
 Introduction to the Practice of StatisticsStatisticsISBN:9781319013387Author:David S. Moore, George P. McCabe, Bruce A. CraigPublisher:W. H. Freeman
MATLAB: An Introduction with Applications
Statistics
ISBN:9781119256830
Author:Amos Gilat
Publisher:John Wiley & Sons Inc
Probability and Statistics for Engineering and th...
Statistics
ISBN:9781305251809
Author:Jay L. Devore
Publisher:Cengage Learning
Statistics for The Behavioral Sciences (MindTap C...
Statistics
ISBN:9781305504912
Author:Frederick J Gravetter, Larry B. Wallnau
Publisher:Cengage Learning
Elementary Statistics: Picturing the World (7th E...
Statistics
ISBN:9780134683416
Author:Ron Larson, Betsy Farber
Publisher:PEARSON
The Basic Practice of Statistics
Statistics
ISBN:9781319042578
Author:David S. Moore, William I. Notz, Michael A. Fligner
Publisher:W. H. Freeman
Introduction to the Practice of Statistics
Statistics
ISBN:9781319013387
Author:David S. Moore, George P. McCabe, Bruce A. Craig
Publisher:W. H. Freeman