
MATLAB: An Introduction with Applications
6th Edition
ISBN: 9781119256830
Author: Amos Gilat
Publisher: John Wiley & Sons Inc
expand_more
expand_more
format_list_bulleted
Related questions
Question
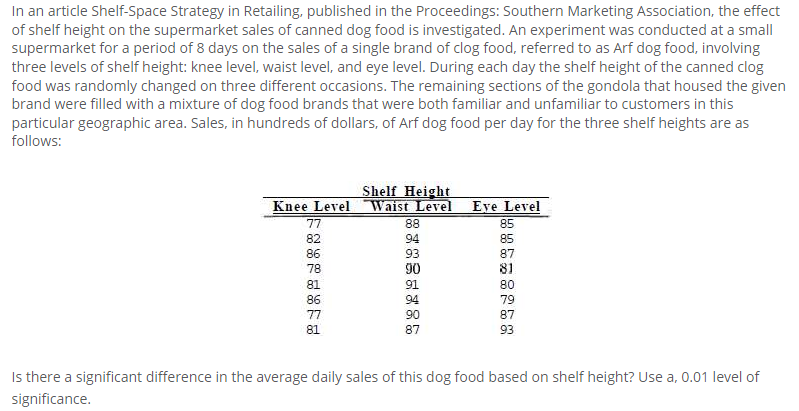

Transcribed Image Text:In an article Shelf-Space Strategy in Retailing, published in the Proceedings: Southern Marketing Association, the effect
of shelf height on the supermarket sales of canned dog food is investigated. An experiment was conducted at a small
supermarket for a period of 8 days on the sales of a single brand of clog food, referred to as Arf dog food, involving
three levels of shelf height: knee level, waist level, and eye level. During each day the shelf height of the canned clog
food was randomly changed on three different occasions. The remaining sections of the gondola that housed the given
brand were filled with a mixture of dog food brands that were both familiar and unfamiliar to customers in this
particular geographic area. Sales, in hundreds of dollars, of Arf dog food per day for the three shelf heights are as
follows:
Shelf Height
Knee Level Waist Level
88
Eye Level
77
85
82
94
85
86
93
90
87
78
81
81
91
80
86
94
79
77
90
87
81
87
93
Is there a significant difference in the average daily sales of this dog food based on shelf height? Use a, 0.01 level of
significance.
Expert Solution
This question has been solved!
Explore an expertly crafted, step-by-step solution for a thorough understanding of key concepts.

This is a popular solution

Trending nowThis is a popular solution!

Step by stepSolved in 4 steps

Knowledge Booster

Similar questions
- TABLE 2.5 Student teachers are trained to develop lesson plans, on the assumption that the writ- ten plan will help them to perform successfully in the classroom. In a study to assess the relationship between written lesson plans and their implementation in the class- room, 25 lesson plans were scored on a scale of 0 to 34 according to a Lesson Plan Assessment Checklist. The 25 scores are shown in Table 2.5. Use Tchebysheff's The- orem and the Empirical Rule (if applicable) to describe the distribution of these assessment scores. Lesson Plan Assessment Scores 26.1 26.0 14.5 29.3 19.7 22.1 21.2 26.6 31.9 25.0 15.9 20.8 20.2 17.8 13.3 25.6 26.5 15.7 22.1 13.8 29.0 21.3 23.5 22.1 10.2arrow_forwardA researcher is interested in investigating the relationship between sugar consumption and weight gain for high school students. 15 volunteers were randomly assigned to one of two groups. The first group contained 6 volunteers who were put on a low sugar diet. The second group consisting of the remaining 9 volunteers was put on a diet with sugar constituting approximately 15% of their diet. After 8 weeks, the change in weight was recorded for each of the volunteers. Question: What is the response variable? What study principle was used in this study and what kind of study is this?arrow_forwardStudy 2: Pill Appearance and Perceived Pain. Does the shape or color of a pain pill influence its effectiveness? Although logically it shouldn’t, whether we believe a drug will work does have a powerful effect on our perceptions (e.g., placebo effect). In this experiment, 4 groups of adult patients were given the same amount of Advil after dental surgery for pain relief, but the color and shape of the pill varied. Researchers hypothesized that an unusual shape or color would lead people to believe the pills were new and special and thus would expect them to be more effective than common round, white pills. Researchers also wanted to know if there is an interaction between shape and color Data Labels ShapePill {1=Round; 2=Diamond} ColorPill {1=White; 2=BlueGreen} Gender {0=Woman; 1=Man; 2=Nonbinary person) Descriptions of the Variables and Descriptive Statistics: Referring to the JASP output, and using sentences, present the descriptive statistics of each group: for example:…arrow_forward
- A study was conducted to determine whether big-city and small-town dwellers differed in their helpfulness to strangers. In this study, the investigators rang the doorbells of strangers living in a large City or small towns in the vicinity. They explained they had misplaced the address of a friend living in the neighbourhood and asked to use the phone. The following data show the number of individuals who admitted or did not admit the strangers (the investigators) into their homes: Helpfulness to strangers Admitted strangers into their home Didnot admit strangers into their home Big city dwellers 60 90 Small town dwellers 70 30 State the dependent and independent variable Is this a directional or non directionalarrow_forward2. A researcher conducts a study examining the effectiveness of a group exercise program at an assisted living facility for elderly adults. One group of residents is selected to participate in the program, and a second group serves as a control. After 6 weeks, the researcher records a combined score measuring balance and strength for each individual. The data are as follows: Control n = 10 M = 12 SS = 120.5 Exercise n = 15 M = 15.5 SS = 190.0 Conduct the four steps for hypothesis testing and label a. Use a two-tailed test with a = .05. each step: Step1, Step 2, Step 3, and Step 4. b. Calculate Cohen's d. c. Are the data sufficient to conclude that thier is a significant difference? Write your answer in the form of a sentence.arrow_forwardJohnson and Leone describe an experiment to investigate the warping of copper plates. The two factors studied were temperature and the copper content of the plates. The response variable was a measure of the amount of warping. The data are as follows: Temperature (°C) 50 75 100 Copper Content (%) 40 60 80 100 17 20 12 9 16 12 21 17 21 16 24 21 18 13 18 21 ZZFEHERRE 23 22 27 17 27 31 30 23 29 31 12 25 23 23 28 22 125 Source: Applied Statistics and Probability for Engineers, 6th Edition, Douglas, C. Montgomery & George, C. Runger. 1. Draw and interpret the interaction plot. ii. Is there any significant interaction between the factors? Use a = 0.05. ii. Can your interpretation in (i) be validated in (ii)? Twelve plants are randomlyarrow_forward
- The medical researcher is comparing two treatments for lowering cholesterol: diet and meds. The researcher wants to see if the patients who receive the recommendation to change their diet have less success lowering cholesterol compared to a prescription of meds. A random sample of some patients who received the recommendation to change their diet and others who were prescribed meds was taken. The results of how many did or did not lower their cholesterol are shown below: Data on Diet vs. Meds for Weight Los Diet Meds Yes 416 483 No 266 248 What can be concluded at the a = 0.05 level of significance? %3D For this study, we should use Select an answer a. The null and alternative hypotheses would be: Ho: Select an answer > Select an answer Select an answer O (please enter a decimal) Hj: Select an answer Select an answer Select an answer O (Please enter a decimal) b. The test statistic ? O (please show your answer to 3 decimal places.) c. The p-value = (Please show your answer to %3D 4…arrow_forwardAmong the literature on quitting smoking are data detailing the relative successfulness of people of different ages in quitting smoking. A study of 400 adults who began various smoking-cessation programs produced the data in the table below. In the table, each participant is classified according to two variables: length of their smoking cessation period ("Less than two weeks", "Between two weeks and one year", or "At least one year") and age ("21-34", or "35 and over"). In the table, "less than two weeks" means that the individual returned to smoking within two weeks of beginning the program; "between two weeks and one year" means that the individual lasted the first two weeks without smoking but retuned to smoking within a year; and "at least one year" means that the individual has not smoked for at least a year since beginning the program. The table is a contingency table whose cells contain the respective observed frequencies of classifications of the 400 smokers. In addition, three…arrow_forward
arrow_back_ios
arrow_forward_ios
Recommended textbooks for you
- MATLAB: An Introduction with ApplicationsStatisticsISBN:9781119256830Author:Amos GilatPublisher:John Wiley & Sons Inc
 Probability and Statistics for Engineering and th...StatisticsISBN:9781305251809Author:Jay L. DevorePublisher:Cengage Learning
 Statistics for The Behavioral Sciences (MindTap C...StatisticsISBN:9781305504912Author:Frederick J Gravetter, Larry B. WallnauPublisher:Cengage Learning
  Elementary Statistics: Picturing the World (7th E...StatisticsISBN:9780134683416Author:Ron Larson, Betsy FarberPublisher:PEARSON
 The Basic Practice of StatisticsStatisticsISBN:9781319042578Author:David S. Moore, William I. Notz, Michael A. FlignerPublisher:W. H. Freeman
 Introduction to the Practice of StatisticsStatisticsISBN:9781319013387Author:David S. Moore, George P. McCabe, Bruce A. CraigPublisher:W. H. Freeman
MATLAB: An Introduction with Applications
Statistics
ISBN:9781119256830
Author:Amos Gilat
Publisher:John Wiley & Sons Inc
Probability and Statistics for Engineering and th...
Statistics
ISBN:9781305251809
Author:Jay L. Devore
Publisher:Cengage Learning
Statistics for The Behavioral Sciences (MindTap C...
Statistics
ISBN:9781305504912
Author:Frederick J Gravetter, Larry B. Wallnau
Publisher:Cengage Learning
Elementary Statistics: Picturing the World (7th E...
Statistics
ISBN:9780134683416
Author:Ron Larson, Betsy Farber
Publisher:PEARSON
The Basic Practice of Statistics
Statistics
ISBN:9781319042578
Author:David S. Moore, William I. Notz, Michael A. Fligner
Publisher:W. H. Freeman
Introduction to the Practice of Statistics
Statistics
ISBN:9781319013387
Author:David S. Moore, George P. McCabe, Bruce A. Craig
Publisher:W. H. Freeman