
MATLAB: An Introduction with Applications
6th Edition
ISBN: 9781119256830
Author: Amos Gilat
Publisher: John Wiley & Sons Inc
expand_more
expand_more
format_list_bulleted
Related questions
Question

Transcribed Image Text:Dw m
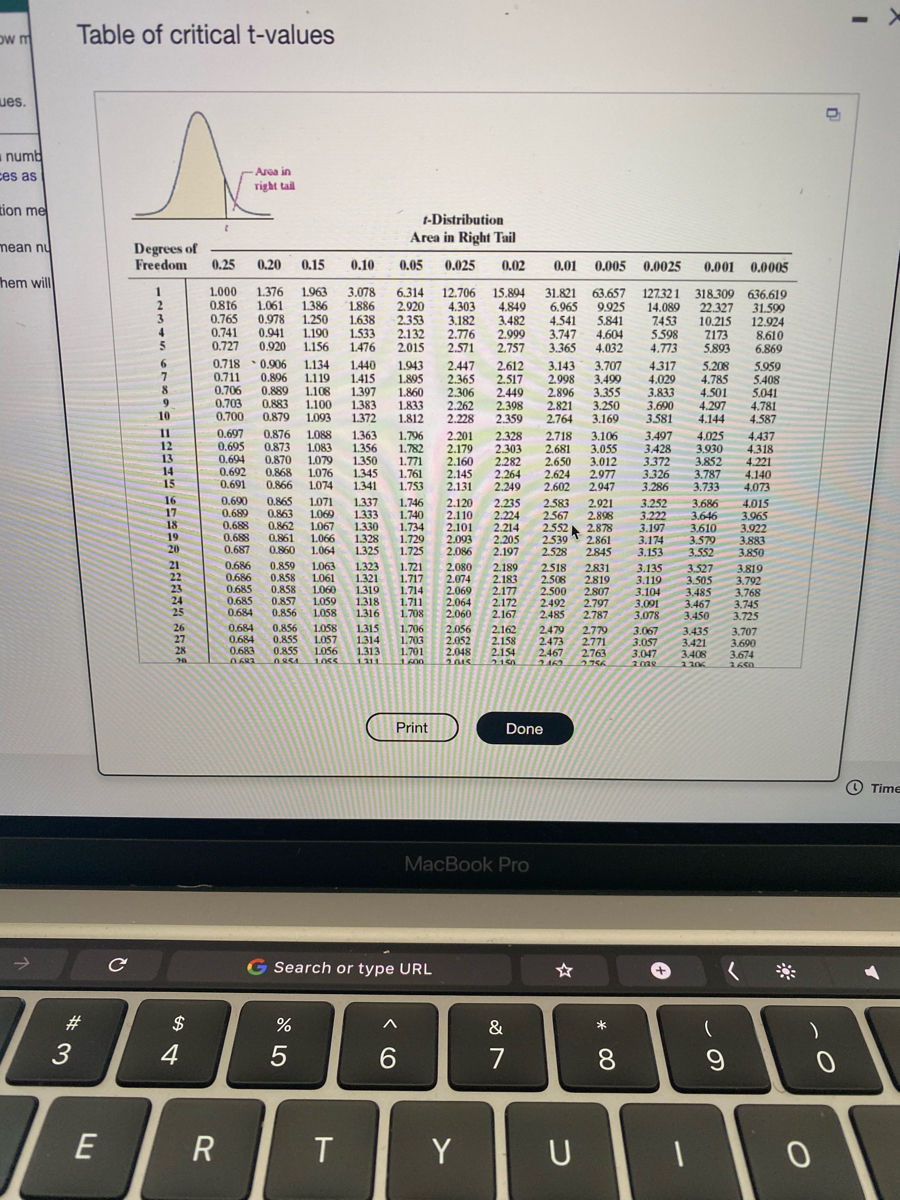
Table of critical t-values
ues.
numb
Area in
ces as
right tail
tion me
t-Distribution
Area in Right Tail
mean nu
Degrees of
Freedom
0.25
0,20
0.15
0.10
0,05
0.025
0.02
0.01
0.005
0.0025
0.001 0.0005
hem will
1
1.000
1.376
1.061
0.978
0.941
0.727 0.920
1.963
1.386
1.250
3.078
1.886
1.638
1.533
1.476
6.314
2.920
2.353
2.132
2.015
12.706 15.894
4.303
3.182
2.776
2.571
31.821
6.965
4.541
3.747
3.365
63.657
9.925
5841
4.604
4.032
127.32 1
14.089
7453
5.598
4.773
318.309 636.619
22.327
31.599
10.215
12.924
2173
8.610
5.893
0816
4.849
0.765
0.741
3.482
4.
1.190
1.156
2.999
2.757
6.869
0.718 * 0.906
0,711
0.706
0.703
0.700
6.
1.134
1.440
1.943
2.447
2.365
2.306
2.612
2.517
2.449
3.143
2.998
2.896
3.707
3.499
4.317
4.029
3.833
3.690
3.581
5.208
4.785
5.959
0.896
0.889
0,883
0,879
1.119
1.108
1.100
1.415
1.397
1.383
1.372
1.895
1.860
1.833
5408
3.355
3.250
3.169
4.501
4.297
4.144
5,041
2.262
2.228
2.398
2.359
2.821
2.764
4.781
4.587
10
1.093
1.812
11
12
13
14
15
0.697
0.695
0.694
0.692
0.691
0.876
0.873
0.870
0.868
0.866
1.088
1.083
1.079
1.076
1.074
1.363
1.356
1.350
1.345
1.341
1.796
1.782
1.771
1.761
1.753
2.201
2.179
2.160
2.145
2.131
2.328
2.303
2.282
2.264
2.249
2.718
2.681
2.650
2.624
2.602
3.106
3.055
3.012
2.977
2.947
3.497
3.428
3.372
3326
3.286
4.025
3.930
3,852
3.787
3.733
4,437
4.318
4.221
4.140
4.073
16
17
18
19
20
0.690
0.689
0.688
0.688
0.687
0.865
0.863
0.862
1.071
1.069
1.067
1.066
1.064
1.337
1.333
1.330
1.328
1.325
1.746
1.740
1.734
2.120
2.110
2.101
2.093
2.086
2.235
2.224
2.214
2.205
2.197
2.583
2.567
2.552
2539
2.528
2.921
2.898
2.878
2.861
2845
3.252
3.222
3.197
3.174
3.153
3.686
3.646
3.610
3.579
3.552
4.015
3.965
3.922
3.883
3.850
0.861
0.860
1.729
1.725
0.686
0.686
0.685
0,685
0.684
21
0.859
0,858
0.858
0.857
0.856
1.063
1.061
1.060
1.059
1.058
1.323
1.321
1.319
1.318
1.316
1.721
1.717
2.080
2.074
2.069
2.064
2.060
2.189
2.183
2.177
2.172
2.167
2518
2.508
2831
2.819
2.807
2.797
2.787
3.135
3.119
3.104
3.091
3.078
3.527
3.505
3.485
3.467
3.450
3.819
3.792
3.768
22
23
24
25
1.714
1.711
1.708
2.500
2.492
2.485
3.745
3.725
26
27
28
0.684
0.684
0.683
0.856
0.855
0.855
1.058
1.057
1.056
1.315
1314
1.313
1.706
1.703
1.701
2.056
2.052
2.048
2.162
2.158
2.154
2150
2.479
2.473
2.467
2779
2.771
2.763
3.067
3.057
3.047
3.435
3.421
3.408
1 206
3.707
3.690
3.674
0683
1600
2015
2756
2008
1650
Print
Done
O Time
MacBook Pro
G Search or type URL
+
23
$
&
*
4
7
8.
E
R
Y
U

Transcribed Image Text:A survey was conducted that asked 1016 people how many books they had read in the past year. Results indicated that x = 11.5 books and s = 16.6 books. Construct a 90% confidence interval for the mean number of books people read. Interpret
the interval.
E Click the icon to view the table of critical t-values.
....
Construct a 90% confidence interval for the mean number of books people read and interpret the result. Select the correct choice below and fill in the answer boxes to complete your choice.
(Use ascending order. Round to two decimal places as needed.)
O A. There is 90% confidence that the population mean number of books read
between and
O B. There is a 90% probability that the true mean number of books read is between
and
O C. If repeated samples are taken, 90% of them will have a sample mean between and
More
O Time Remaining: 01:49:50
Next
MacBook Pro
く
esc
G Search or type URL
23
$
%
&
-
delete
1
2
3
5
7
Q
W
E
R
T
Y
tab
11
H
K
.. ..
つ
Expert Solution
This question has been solved!
Explore an expertly crafted, step-by-step solution for a thorough understanding of key concepts.

This is a popular solution

Trending nowThis is a popular solution!

Step by stepSolved in 2 steps with 2 images

Knowledge Booster

Similar questions
- A survey was conducted that asked 1019 people how many books they had read in the past year. Results indicated that x 14.2 books and s= 16.6 books. Construct a 95% confidence interval for the mean number of books people read. Interpret the interval. Click the icon to view the table of critical t-values. Construct a 95% confidence interval for the mean number of books people read and interpret the result. Select the correct choice below and fill in the answer boxes to complete your choice. (Use ascending order. Round to two decimal places as needed.) OA. If repeated samples are taken, 95% of them will have a sample mean between 08. There is a 95% probability that the true mean number of books read is between OC. There is 95% confidence that the population mean number of books read is between and and andarrow_forwardConstruct a 90% confidence interval for the mean when x̅=50 and there are 31 observations. Suppose σ=7. What is the confidence interval?arrow_forwardDescribe when you would use a t-score instead of a z-score when finding a confidence interval.arrow_forward
- (0.24, 0.56) is a confidence interval for the proportion of people who liked a new soda flavor. What was the sample proportion for those who did NOT like the new soda flavor? Type the exact answer as a decimal.arrow_forwardA poll commissioned by the Center on Addiction and Substance Abuse at Columbia University found that 1,340 out of 2,000 adults interviewed believed that popular culture encourages drug use. Find a 98% confidence interval for the true proportion of adults nationwide having the belief. (Z score for 98% = 2.326)arrow_forwardA poll was conducted that asked 1017 people how many books they had read in the past year. Results indicated that x= 13.9 books ands= 16.6 books. Construct a 95% confidence interval for the mean number of books people read. Click the icon to view the table of areas under the t-distribution. Question Help v Construct a 95% confidence interval for the mean number of books people read. (Use ascending order. Round to two decimal plaçes as needed.) Enter your answer in the edit fields and then click Check Answer. All parts showing Clear All Check Answer P Type here to search 451 PM 4/11/2021 A= 4 de ENG DELL Pgup Delete PrtScr Insert F11 F12 F9 F10 F7 F8 F5 F6 F4 F3 40) Esc F1 F2 Backspace & %3D 24 % 6. 8. 7arrow_forward
- A survey was conducted that asked 1016 people how many books they had read in the past year. Results indicated that x=12.5 books and s=16.6 books. Construct a 99% confidence interval for the mean number of books people read. Interpret the interval. LOADING... Click the icon to view the table of critical t-values. Construct a 99% confidence interval for the mean number of books people read and interpret the result. Select the correct choice below and fill in the answer boxes to complete your choice. (Use ascending order. Round to two decimal places as needed.) A. If repeated samples are taken, 99% of them will have a sample mean between nothingand nothing. B. There is 99% confidence that the population mean number of books read is between nothing and nothing. C. There is a 99% probability that the true mean number of books read is between nothing and nothing. Pick answer and fill in blank plsarrow_forwardThe ability to find a job after graduation is very important to GSU students as it is to the students at most colleges and universities. Suppose we take a poll (random sample) of 3878 students classified as Juniors and find that 3241 of them believe that they will find a job immediately after graduation. Find the 95% confidence interval for the proportion of GSU Juniors who believe that they will, immediately, be employed after graduation. Use Z = 1.96. Use the unrounded values in Excel to find the answers to #2, #3 and #4. 1. Find the sample proportion of GSU Juniors who believe that they will, immediately, be graduation. 2. The standard error for sample proportion has a value of 3. The margin of error has a value of --arrow_forwardA survey was conducted that asked 1016 people how many books they had read in the past year. Results indicated that x= 13.7 books and s= 16.6 books. Construct a 95% confidence interval for the mean number of books people read. Interpret the interval. Click the icon to view the table of critical t-values. Question Viewer Construct a 95% confidence interval for the mean number of books people read and interpret the result. Select the correct choice below and fill in the answer boxes to complete your choice. (Use ascending order. Round to two decimal places as needed.) A. There is a 95% probability that the true mean number of books read is between B. If repeated samples are taken, 95% of them will have a sample mean between Table of critical t-values OC. There is 95% confidence that the population mean number of books read is between and Area in right ta -Distribution Area in Right Tail Degrees of Freedom 0.25 0.20 0.15 0.10 0.05 0.025 0.02 0,01 0.005 0,0025 0.001 0.0005 1000 0816 0.765…arrow_forward
- A survey was conducted that asked 1016 people how many books they had read in the past year. Results indicated that x = 13.3 books and s= 16.6 books. Construct a 90% confidence interval for the mean number of books people read. Interpret the interval. Click the icon to view the table of critical t-values. Construct a 90% confidence interval for the mean number of books people read and interpret the result. Select the correct choice below and fill in the answer boxes to complete your choice. (Use ascending order. Round to two decimal places as needed.) OA. If repeated samples are taken, 90% of them will have a sample mean between and OB. There is 90% confidence that the population mean number of books read is between and OC. There is a 90% probability that the true mean number of books read is between andarrow_forward(in hours): 7, 6, 7, 8.5, 8, 9, 6.5 a. Find the mean, median, mode and standard deviation for their hours of sleep. b. Create a 99% confidence interval for the mean amount of hours they slept.arrow_forwardA Surprising fact indicates that a small proportion of teens use a password on their mobile device. A poll chooses a simple random sample of 120 teens and asks if they use a password on their mobile device. The results showed that 56 of teens in our sample used a password on their mobile device. Find a 90 % confidence interval for the proportion of teens who use a password on their mobile device. Interpret your confidence interval.arrow_forward
arrow_back_ios
SEE MORE QUESTIONS
arrow_forward_ios
Recommended textbooks for you
- MATLAB: An Introduction with ApplicationsStatisticsISBN:9781119256830Author:Amos GilatPublisher:John Wiley & Sons Inc
 Probability and Statistics for Engineering and th...StatisticsISBN:9781305251809Author:Jay L. DevorePublisher:Cengage Learning
 Statistics for The Behavioral Sciences (MindTap C...StatisticsISBN:9781305504912Author:Frederick J Gravetter, Larry B. WallnauPublisher:Cengage Learning
  Elementary Statistics: Picturing the World (7th E...StatisticsISBN:9780134683416Author:Ron Larson, Betsy FarberPublisher:PEARSON
 The Basic Practice of StatisticsStatisticsISBN:9781319042578Author:David S. Moore, William I. Notz, Michael A. FlignerPublisher:W. H. Freeman
 Introduction to the Practice of StatisticsStatisticsISBN:9781319013387Author:David S. Moore, George P. McCabe, Bruce A. CraigPublisher:W. H. Freeman
MATLAB: An Introduction with Applications
Statistics
ISBN:9781119256830
Author:Amos Gilat
Publisher:John Wiley & Sons Inc
Probability and Statistics for Engineering and th...
Statistics
ISBN:9781305251809
Author:Jay L. Devore
Publisher:Cengage Learning
Statistics for The Behavioral Sciences (MindTap C...
Statistics
ISBN:9781305504912
Author:Frederick J Gravetter, Larry B. Wallnau
Publisher:Cengage Learning
Elementary Statistics: Picturing the World (7th E...
Statistics
ISBN:9780134683416
Author:Ron Larson, Betsy Farber
Publisher:PEARSON
The Basic Practice of Statistics
Statistics
ISBN:9781319042578
Author:David S. Moore, William I. Notz, Michael A. Fligner
Publisher:W. H. Freeman
Introduction to the Practice of Statistics
Statistics
ISBN:9781319013387
Author:David S. Moore, George P. McCabe, Bruce A. Craig
Publisher:W. H. Freeman