
MATLAB: An Introduction with Applications
6th Edition
ISBN: 9781119256830
Author: Amos Gilat
Publisher: John Wiley & Sons Inc
expand_more
expand_more
format_list_bulleted
Related questions
Question
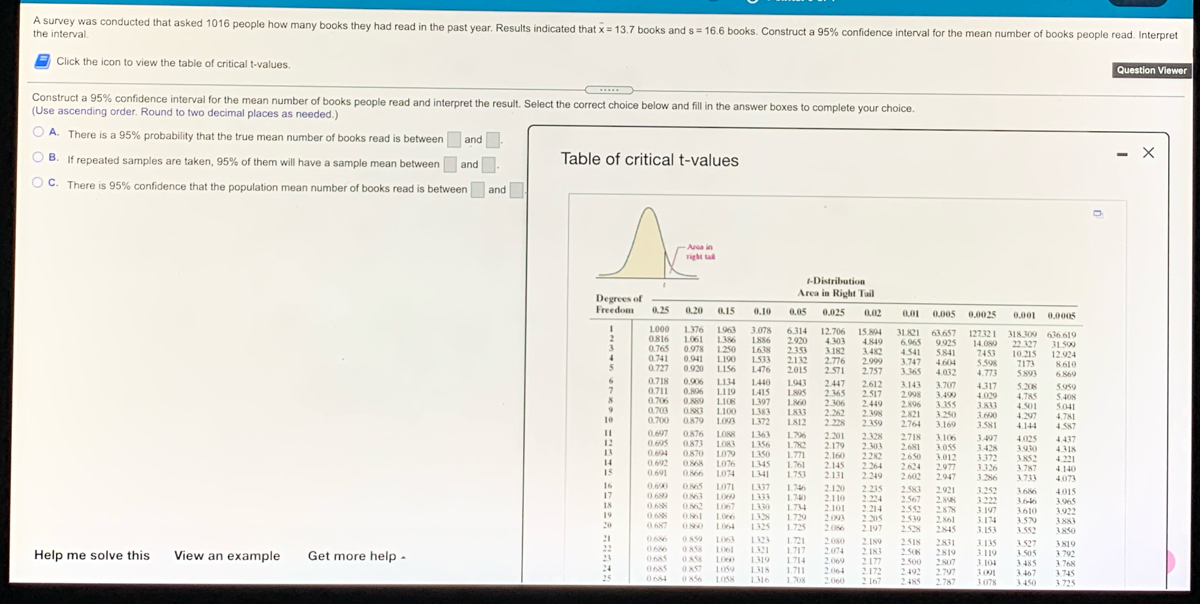

Transcribed Image Text:A survey was conducted that asked 1016 people how many books they had read in the past year. Results indicated that x= 13.7 books and s= 16.6 books. Construct a 95% confidence interval for the mean number of books people read. Interpret
the interval.
Click the icon to view the table of critical t-values.
Question Viewer
Construct a 95% confidence interval for the mean number of books people read and interpret the result. Select the correct choice below and fill in the answer boxes to complete your choice.
(Use ascending order. Round to two decimal places as needed.)
A. There is a 95% probability that the true mean number of books read is between
B. If repeated samples are taken, 95% of them will have a sample mean between
Table of critical t-values
OC. There is 95% confidence that the population mean number of books read is between
and
Area in
right ta
-Distribution
Area in Right Tail
Degrees of
Freedom
0.25
0.20
0.15
0.10
0.05
0.025
0.02
0,01 0.005
0,0025
0.001 0.0005
1000
0816
0.765
0.741
0.727
1.376
1061
0.978
0.941
0.920
3.078
1963
L386
1.250
L190
L156
1886
1638
1.533
1476
6.314
2.920
2.353
2.132
2015
12.706 15.894
4303
3.182
2.776
2.571
31.821 63.657
6.965
4.541
3.747
3.365
127321 318.309 636.619
22.327
10.215
Z173
5893
4849
9.925
5841
14.089
7453
5.598
4.773
31.599
12.924
3.
3.482
2.999
2.757
4.604
8610
4.032
6.869
0.718
0.711
0.706
0.703
0.700
0.906
L134
L119
1440
L415
1.397
1383
1.372
1943
1895
1860
2.447
2.365
2.306
2.612
2.517
3.143
2.998
2.896
2821
2.764
3.707
4.317
4.029
3.83
3.690
5.208
4.785
4.501
5.959
5.408
5041
4.781
0.806
0.889
O.S83
0879
2.449
2.398
2.359
3.499
3.355
3.250
3.169
L100
2.262
2.228
4.297
4.144
10
1812
3.581
4.587
0.697
0.695
O876
0873
LOSS
1.363
1356
1.350
1345
1.341
1.796
1.782
2.201
2.179
2.160
2.145
2.131
2328
2.303
2282
2.264
2.249
2.718
2.681
2.650
2.624
2.602
3.106
3.055
3.012
2977
2947
3.497
4.025
3.9t0
3852
4.437
12
13
LO83
3.428
3372
3.326
3.286
3.252
3.222
3.197
3.174
3. I53
4318
0.694
0.692
0.691
0870
1.771
1.761
1.753
4.221
14
15
0868
LO76
LO74
3.787
4.140
066
3.733
4073
16
O65
LO7I
L337
1333
L330
1328
0.600
1.746
1.740
1.74
1.729
1.725
2.120
2.110
2.101
2093
2.086
2.235
2.224
2.583
2921
2.88
2878
366
4015
3.965
3.922
3.883
3850
17
0.699
0.68
O63
2567
18
062
LO67
2.214
2.205
2.197
2552
2539
3610
19
0688
LO6
LO64
2. K6l
2845
20
0687
1325
2528
3.552
0686
1323
1.721
1717
2.080
2074
2.069
2064
2060
2. 189
2 I83
2177
2.172
2 167
2518
2508
2500
2492
248S
2831
2819
2S07
2.797
2.787
3.135
3.119
3.104
3001
3078
3527
3819
3.792
1321
1319
1318
1316
Help me solve this
View an example
Get more help -
0685
1.714
3485
3467
3.450
1768
24
0685
O 8S7
LO59
1.711
1.08
3.745
LOSS
3725
Expert Solution
This question has been solved!
Explore an expertly crafted, step-by-step solution for a thorough understanding of key concepts.

This is a popular solution

Trending nowThis is a popular solution!

Step by stepSolved in 2 steps with 2 images

Knowledge Booster

Similar questions
- Construct a 95% confidence interval for the mean number of books people read. (_,_)arrow_forwardconstruct a confidence interval for this data. You should construct a 95% confidence interval for this data. How you do this will depend on whether your data is summarized using a mean or proportions. If you have categorical data, you will have to pick one of the categories and focus on a confidence interval for the proportion for that category, and you only need to do one for that one category. Please show the parts of your equation (point estimate, Z or T, and standard error) in addition to your final result.arrow_forwardUse the .05 level of significance. Solve for the appropriate test statisticarrow_forward
- A survey was conducted that asked 1016 people how many books they had read in the past year. Results indicated that x = 13.3 books and s= 16.6 books. Construct a 90% confidence interval for the mean number of books people read. Interpret the interval. Click the icon to view the table of critical t-values. Construct a 90% confidence interval for the mean number of books people read and interpret the result. Select the correct choice below and fill in the answer boxes to complete your choice. (Use ascending order. Round to two decimal places as needed.) OA. If repeated samples are taken, 90% of them will have a sample mean between and OB. There is 90% confidence that the population mean number of books read is between and OC. There is a 90% probability that the true mean number of books read is between andarrow_forwardYou must estimate the mean. 60, 59.3, 49.7, 23.9, 44, 39.4, 85.2, 46 mean = 50.9375Find the 98% confidence interval. Enter your answer as an open interval (i.e. parentheses) accurate to two decimal places.arrow_forwardPlease helparrow_forward
- Subject; stetesticarrow_forwardPlease answer all. Thank you. A national random sample of 20 NCAE Scores from 2010 is listed below. 29,26,13,23,23,25,17,22,17,19 12,26,30,30,18,14,12,26,17,18 Calculate the 95 percent confidence interval for the mean NCAE score if the sample standard deviation is about 5.9407. A.) between 18.22 and 23.48 B.) between 18.07 and 23.63 C.) between negative infinity and 23.15 D.) between negative infinity and 23.05 The value of z selected for constructing a given confidence interval is called A.) confidence B.) error C.) student D.) critical valuearrow_forwardA survey was conducted that asked 1009 people how many books they had read in the past year. Results indicated that x = 14.4 books and s= 16.6 books. Construct a 90% confidence interval for the mean number of books people read. Interpret the interval. Click the icon to view the table of critical t-values. C Construct a 90% confidence interval for the mean number of books people read and interpret the result. Select the correct choice below and fill in the answer boxes to complete your choice. (Use ascending order. Round to two decimal places as needed.) OA. If repeated samples are taken, 90% of them will have a sample mean between and H OB. There is a 90% probability that the true mean number of books read is between and OC. There is 90% confidence that the population mean number of books read is between andarrow_forward
- Use the range rule of thumb to identify the values that are significantly low, the values that are signficantly high, and the values that are neither significantly low nor significantly high. A test is used to assess readiness for college. In a recent year, the mean test score was 19.9 and the standard deviation was 4.7. Identify the test scores that are significantly low or significantly high. C What test scores are significantly low? Select the correct answer below and fill in the answer box(es) to complete your choice. (Round to one decimal place as needed.) O A. Test scores that are less than O B. Test scores that are between OC. Test scores that are greater than and (Round to one decimal place as needed. Use ascending order.) (Round to one decimal place as needed.) What test scores are significantly high? Select the correct answer below and fill in the answer box(es) to complete your choice. O A. Test scores that are greater than O B. Test scores that are less than O C. Test…arrow_forward1. Explain how to find a confidence interval for a population proportion using StatCrunch. 2. Explain how to find the margin of error given a confidence interval for a population proportion.arrow_forwardPlease answer A B C Darrow_forward
arrow_back_ios
SEE MORE QUESTIONS
arrow_forward_ios
Recommended textbooks for you
- MATLAB: An Introduction with ApplicationsStatisticsISBN:9781119256830Author:Amos GilatPublisher:John Wiley & Sons Inc
 Probability and Statistics for Engineering and th...StatisticsISBN:9781305251809Author:Jay L. DevorePublisher:Cengage Learning
 Statistics for The Behavioral Sciences (MindTap C...StatisticsISBN:9781305504912Author:Frederick J Gravetter, Larry B. WallnauPublisher:Cengage Learning
  Elementary Statistics: Picturing the World (7th E...StatisticsISBN:9780134683416Author:Ron Larson, Betsy FarberPublisher:PEARSON
 The Basic Practice of StatisticsStatisticsISBN:9781319042578Author:David S. Moore, William I. Notz, Michael A. FlignerPublisher:W. H. Freeman
 Introduction to the Practice of StatisticsStatisticsISBN:9781319013387Author:David S. Moore, George P. McCabe, Bruce A. CraigPublisher:W. H. Freeman
MATLAB: An Introduction with Applications
Statistics
ISBN:9781119256830
Author:Amos Gilat
Publisher:John Wiley & Sons Inc
Probability and Statistics for Engineering and th...
Statistics
ISBN:9781305251809
Author:Jay L. Devore
Publisher:Cengage Learning
Statistics for The Behavioral Sciences (MindTap C...
Statistics
ISBN:9781305504912
Author:Frederick J Gravetter, Larry B. Wallnau
Publisher:Cengage Learning
Elementary Statistics: Picturing the World (7th E...
Statistics
ISBN:9780134683416
Author:Ron Larson, Betsy Farber
Publisher:PEARSON
The Basic Practice of Statistics
Statistics
ISBN:9781319042578
Author:David S. Moore, William I. Notz, Michael A. Fligner
Publisher:W. H. Freeman
Introduction to the Practice of Statistics
Statistics
ISBN:9781319013387
Author:David S. Moore, George P. McCabe, Bruce A. Craig
Publisher:W. H. Freeman