
MATLAB: An Introduction with Applications
6th Edition
ISBN: 9781119256830
Author: Amos Gilat
Publisher: John Wiley & Sons Inc
expand_more
expand_more
format_list_bulleted
Related questions
Topic Video
Question
thumb_up100%
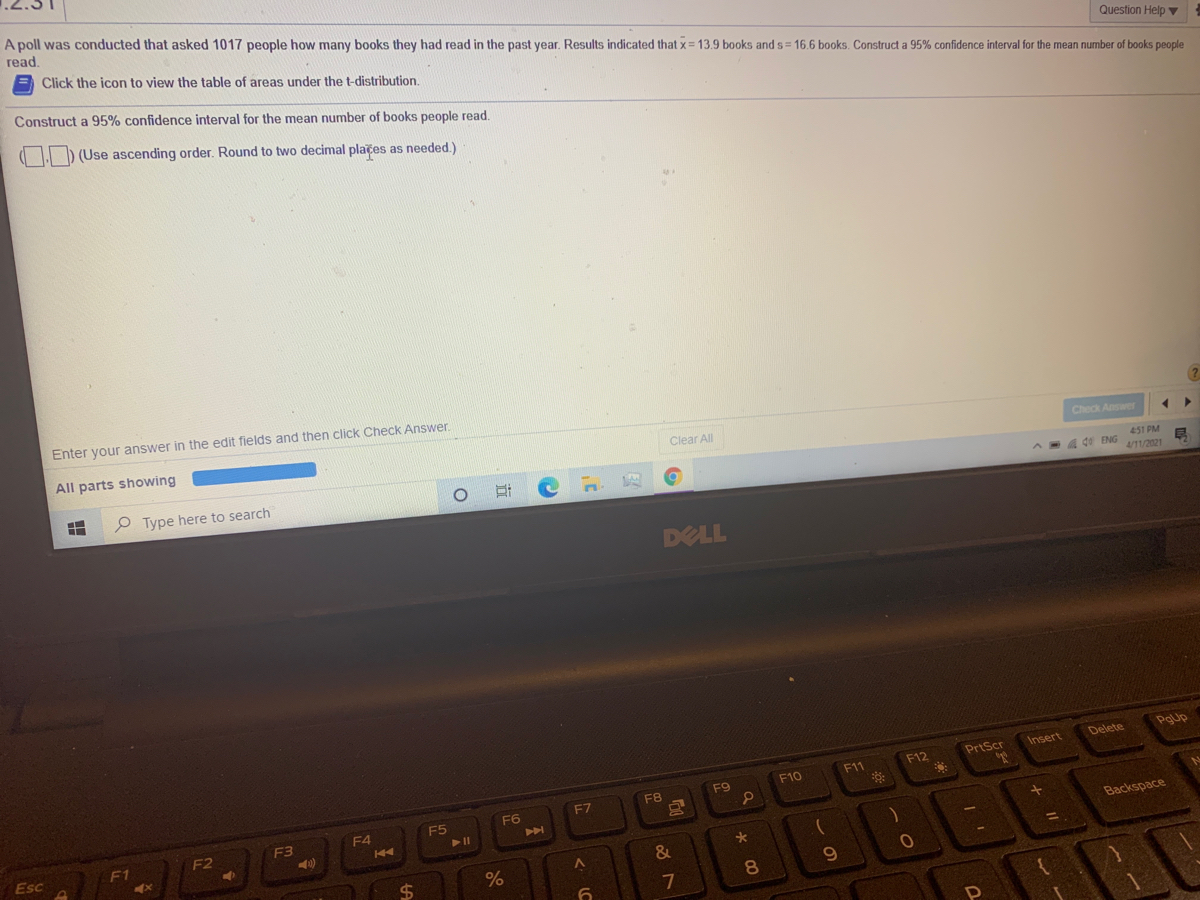

Transcribed Image Text:A poll was conducted that asked 1017 people how many books they had read in the past year. Results indicated that x= 13.9 books ands= 16.6 books. Construct a 95% confidence interval for the mean number of books people
read.
Click the icon to view the table of areas under the t-distribution.
Question Help v
Construct a 95% confidence interval for the mean number of books people read.
(Use ascending order. Round to two decimal plaçes as needed.)
Enter your answer in the edit fields and then click Check Answer.
All parts showing
Clear All
Check Answer
P Type here to search
451 PM
4/11/2021
A= 4
de ENG
DELL
Pgup
Delete
PrtScr
Insert
F11
F12
F9
F10
F7
F8
F5
F6
F4
F3
40)
Esc
F1
F2
Backspace
&
%3D
24
%
6.
8.
7
Expert Solution
This question has been solved!
Explore an expertly crafted, step-by-step solution for a thorough understanding of key concepts.

Step by stepSolved in 2 steps with 2 images

Knowledge Booster


Learn more about
Need a deep-dive on the concept behind this application? Look no further. Learn more about this topic, statistics and related others by exploring similar questions and additional content below.Similar questions
- Answer the questions below. (a) The following number of people attended the last 9 screenings of a movie: 196, 200, 201, 202, 203, 206, 207, 208, 211. Which measure should be used to summarize the data? Mean Median Mode (b) On a test, each student is given a grade of A, B, C, D, or F. Which measure tells the grade given most often? Mean Median Mode (c) In the past 9 days, Greg has received the following numbers of email advertisements per da 41, 42, 43, 44, 47, 48, 49, 52, 87. Which measure should be used to summarize the data? Mean Median Modearrow_forwardLet's look at the relationship between hour Price (in thousands of dollars) and house Size (In thousands of square feet) In Saratoga. The relationship is Price = -3.117 +94.454 Size a. You go to an open house and find that the house is 1 standard deviation above the mean in size. What would you guess about its price? type your answer... b. You read an ad for a house priced 2 standard deviations below the mean. What would you guess about its size? type your answer... c. What does the slope of 94.454 mean? type your answer.... d. What are the units of the slope? type your answer... e. Your house is 2000 sq ft bigger than your neighbor's house. How much more do you expect it to be worth? type your answer.. with r=0.77 f. Is the y-intercept of -3.117 meaningful? Explain. 30000arrow_forwardIn this chapter we leaned that a z-score (also called a standard score) gives you an idea of how far from the mean a data point is. Therefore, which of the following z-score values represents the location farthest from the mean? O +1.00 O -2.00 O -1.00 O +0.50arrow_forward
- Which of the following are correct interpretations of the value of ? Please enter the letters for ALL correct answers. Multiple answers: Multiple answers are accepted for this question Select one or more answers: a. It is the observed value of the dependent variable. b. It is the point estimate for the mean value for all units or subjects at a given value of the independent variable. c. It is the predicted value for a single specific unit or subject at a given value of the independent variable. d. It is the predicted value of the independent variable.arrow_forwardUse z scores to compare the given values. The tallest living man at one time had a height of 245 cm. The shortest living man at that time had a height of 66.4 cm. Heights of men at that time had a mean of 176.91 cm and a standard deviation of 6.51 cm. Which of these two men had the height that was more extreme? Question content area bottom Part 1 Since the z score for the tallest man is z=enter your response here and the z score for the shortest man is z=enter your response here, the ▼ shortest tallest man had the height that was more extreme.arrow_forwardConsider the data below: 17, 11, 10, 13, 1, 6, 18, 21, 8, 5 Compute the mean? Find the median? What is the mode?arrow_forward
- Regan is interested in comparing the outdoor activity of people from different parts of the country. He collects data from people from the East Coast, Midwest, and West Coast and assesses how many minutes per day they spend exercising. What test. should i use? ANOVA Paired samples t test Independent samples t test Correlationarrow_forwardFind the mean, median, and mode of the data, if possible. If any of these measures cannot be found or a measure does not represent the center of the data, explain why. A sample of seven admission test scores for a professional school are listed below. 11.1 , 10.7 , 10.4 , 9.5 , 11 , 9.5 , 11.4 What is the mean score? Select the correct choice below and fill in any answer box to complete your choice. A. The mean score is= (Round to one decimal place as needed.) B. There is no mean score. What is the median score? Select the correct choice below and fill in any answer box to complete your choice. A. The median score is= (Round to one decimal place as needed.) B. There is no median score. What is the mode of the scores? Select the correct choice below and fill in any answer box to complete your choice. A. The mode(s) of the scores is (are)= (Use a comma to separate answers as needed.) B. There is no mode.arrow_forwardCan i get you alls help with the attached?arrow_forward
- A successful basketball player has a height of 6 feet 11 inches, or 211 cm. Based on statistics from a data set, his height converts to the z score of 5.17. How many standard deviations is his height above the mean?arrow_forwardWhich of these is an advantage of using a transformed score when reporting the score of an individual case? a. Transformed scores will allow the mean score to be reported. b. Transformed scores will be reported on the nominal level. c. Transformed scores provide a context for the individual's score d. Transformed scores provide a measure of variability.arrow_forwarddo the last one pleasearrow_forward
arrow_back_ios
SEE MORE QUESTIONS
arrow_forward_ios
Recommended textbooks for you
- MATLAB: An Introduction with ApplicationsStatisticsISBN:9781119256830Author:Amos GilatPublisher:John Wiley & Sons Inc
 Probability and Statistics for Engineering and th...StatisticsISBN:9781305251809Author:Jay L. DevorePublisher:Cengage Learning
 Statistics for The Behavioral Sciences (MindTap C...StatisticsISBN:9781305504912Author:Frederick J Gravetter, Larry B. WallnauPublisher:Cengage Learning
  Elementary Statistics: Picturing the World (7th E...StatisticsISBN:9780134683416Author:Ron Larson, Betsy FarberPublisher:PEARSON
 The Basic Practice of StatisticsStatisticsISBN:9781319042578Author:David S. Moore, William I. Notz, Michael A. FlignerPublisher:W. H. Freeman
 Introduction to the Practice of StatisticsStatisticsISBN:9781319013387Author:David S. Moore, George P. McCabe, Bruce A. CraigPublisher:W. H. Freeman
MATLAB: An Introduction with Applications
Statistics
ISBN:9781119256830
Author:Amos Gilat
Publisher:John Wiley & Sons Inc
Probability and Statistics for Engineering and th...
Statistics
ISBN:9781305251809
Author:Jay L. Devore
Publisher:Cengage Learning
Statistics for The Behavioral Sciences (MindTap C...
Statistics
ISBN:9781305504912
Author:Frederick J Gravetter, Larry B. Wallnau
Publisher:Cengage Learning
Elementary Statistics: Picturing the World (7th E...
Statistics
ISBN:9780134683416
Author:Ron Larson, Betsy Farber
Publisher:PEARSON
The Basic Practice of Statistics
Statistics
ISBN:9781319042578
Author:David S. Moore, William I. Notz, Michael A. Fligner
Publisher:W. H. Freeman
Introduction to the Practice of Statistics
Statistics
ISBN:9781319013387
Author:David S. Moore, George P. McCabe, Bruce A. Craig
Publisher:W. H. Freeman