MATLAB: An Introduction with Applications
6th Edition
ISBN: 9781119256830
Author: Amos Gilat
Publisher: John Wiley & Sons Inc
expand_more
expand_more
format_list_bulleted
Concept explainers
Question

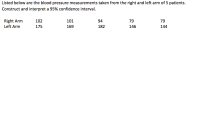
Transcribed Image Text:Listed below are the blood pressure measurements taken from the right and left arm of 5 patients.
Construct and interpret a 95% confidence interval.
Right Arm
Left Arm
102
101
94
79
79
175
169
182
146
144
Expert Solution
arrow_forward
Step 1
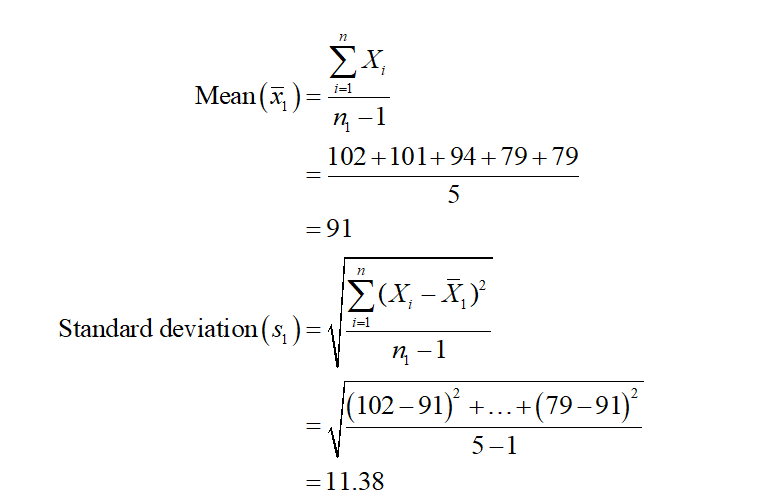
From the provided information,
The mean and standard deviation of the right arm data can be obtained as:

arrow_forward
Step 2
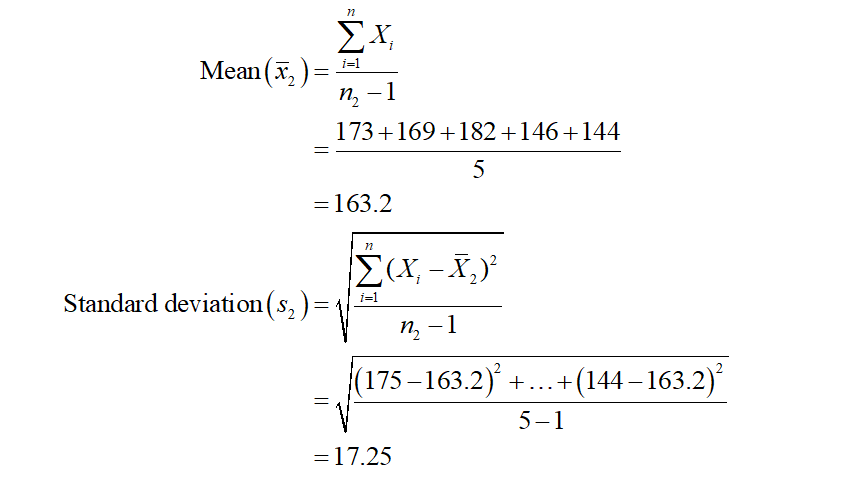
Similarly, the mean and standard deviation of left arm data can be obtained as:

Trending nowThis is a popular solution!
Step by stepSolved in 4 steps with 3 images

Knowledge Booster
Learn more about
Need a deep-dive on the concept behind this application? Look no further. Learn more about this topic, statistics and related others by exploring similar questions and additional content below.Similar questions
- If n = 250 and X = 200, construct a 99% confidence interval for the population proportion, p.Give your answers to three decimalsarrow_forwardYou measure 46 dogs' weights, and find they have a mean weight of 32 ounces. Assume the sample weights' standard deviation is 13.7 ounces. Based on this, construct a 90% confidence interval for the true population mean dog weight.Give your answers as decimals, to two placesarrow_forwardAspirin prevents blood from clotting and helps prevent strokes. The Second European Stroke Prevention Study asked whether adding another anticlotting drug named dipyridamole would make a difference for patients who had already had a stroke. Here are the data on strokes during the two years of the study: Aspirin alone Apsirin & Dipyridamole Number of Patients This test is two-tailed. What is the test statistic? 200 200 # Is there a significant difference in the proportion of strokes in the two groups? Test at a = 0.10. Round your answers to three decimal places, and round any interim calculations to four decimal places. Fill in the hypotheses below where p₁ denotes the proportion of patients in the aspirin group who suffered a stroke and på denotes the proportion of patients in the aspirin & dipyridamole group who suffered a stroke. Ho: P Ha: P₁ Number of Strokes P₂ 60 P₂ 54 Part 2 ofarrow_forward
- A physical fitness trainer has several workouts she developed for increasing female upper body strength. All the workout plans are created based on the average adult women’s bench press ability. The average adult woman can bench 115 lbs. with a standard deviation of 18 pounds. The trainer has a class of 14 females and does an initial test to see if the women are representative of the average female population. Data Female Class Bench Ability (lbs.) 1 130 2 100 3 99 4 114 5 130 6 97 7 114 8 135 9 128 10 128 11 116 12 141 13 113 14 116 Apply the z-test formula Zobt = What is your alpha level set to? α = Write the z result in the correct form:arrow_forwardYou measure 37 textbooks' weights, and find they have a mean weight of 59 ounces. Assume the population standard deviation is 8.8 ounces. Based on this, construct a 90% confidence interval for the true population mean textbook weight.arrow_forwardIf n = 18, = 46, and s = 16, construct a confidence interval at a 90% confidence level. Assume the data came from a normally distributed population. Give your answers to three decimal places.arrow_forward
- Write out your final answer. You do not need to show all the steps. The drug Lipitor is meant to lower cholesterol levels. In a clinical trial of 800 patients, 5% reported headaches. Construct a 90% confidence interval estimate of the proportion of Lipitor users who will report headaches as a side effect. F Format Tools Table Edit View Insert Format 12pt ✓ Paragraph BIU A PE D ✓ T²V TERarrow_forwardA researcher wants to determine if there is a significant difference in the amount of time it takes a US adult to read a 400-word article when an individual is given either a paper or digital version. The sample consists of 64 select voting adults in which each adult experiences both treatments. The researcher required each individual to read the paper version first. The sample mean of the differences was 23.25 seconds. and the standard deviation of the difference was 4.97.arrow_forwardConstruct a confidence interval of the population proportion at the given level of confidence. X = 30 n = 150 C-Level = 0.90 Lower Level = ? Upper Level = ?arrow_forward
- If n=30, (x-bar)=49, and s=14, construct a confidence interval at a 99% confidence level. Assume the data came from a normally distributed population. Give your answers to one decimal place. Check Answerarrow_forwardIf n = 28, a = 37, and s = 6.2, construct a confidence interval at a 97% confidence level. Assume the data came from a normally distributed population. Give your answers to 3 decimal places.arrow_forward= 41, z=30, and s to one decimal place. If n = 6, construct a confidence interval at a 80% confidence level. Give your answers Technology.arrow_forward
arrow_back_ios
SEE MORE QUESTIONS
arrow_forward_ios
Recommended textbooks for you
 MATLAB: An Introduction with ApplicationsStatisticsISBN:9781119256830Author:Amos GilatPublisher:John Wiley & Sons Inc
 Probability and Statistics for Engineering and th...StatisticsISBN:9781305251809Author:Jay L. DevorePublisher:Cengage Learning
 Statistics for The Behavioral Sciences (MindTap C...StatisticsISBN:9781305504912Author:Frederick J Gravetter, Larry B. WallnauPublisher:Cengage Learning
 Elementary Statistics: Picturing the World (7th E...StatisticsISBN:9780134683416Author:Ron Larson, Betsy FarberPublisher:PEARSON
 The Basic Practice of StatisticsStatisticsISBN:9781319042578Author:David S. Moore, William I. Notz, Michael A. FlignerPublisher:W. H. Freeman
 Introduction to the Practice of StatisticsStatisticsISBN:9781319013387Author:David S. Moore, George P. McCabe, Bruce A. CraigPublisher:W. H. Freeman

MATLAB: An Introduction with Applications
Statistics
ISBN:9781119256830
Author:Amos Gilat
Publisher:John Wiley & Sons Inc

Probability and Statistics for Engineering and th...
Statistics
ISBN:9781305251809
Author:Jay L. Devore
Publisher:Cengage Learning

Statistics for The Behavioral Sciences (MindTap C...
Statistics
ISBN:9781305504912
Author:Frederick J Gravetter, Larry B. Wallnau
Publisher:Cengage Learning

Elementary Statistics: Picturing the World (7th E...
Statistics
ISBN:9780134683416
Author:Ron Larson, Betsy Farber
Publisher:PEARSON

The Basic Practice of Statistics
Statistics
ISBN:9781319042578
Author:David S. Moore, William I. Notz, Michael A. Fligner
Publisher:W. H. Freeman

Introduction to the Practice of Statistics
Statistics
ISBN:9781319013387
Author:David S. Moore, George P. McCabe, Bruce A. Craig
Publisher:W. H. Freeman