
MATLAB: An Introduction with Applications
6th Edition
ISBN: 9781119256830
Author: Amos Gilat
Publisher: John Wiley & Sons Inc
expand_more
expand_more
format_list_bulleted
Related questions
Concept explainers
Question
thumb_up100%
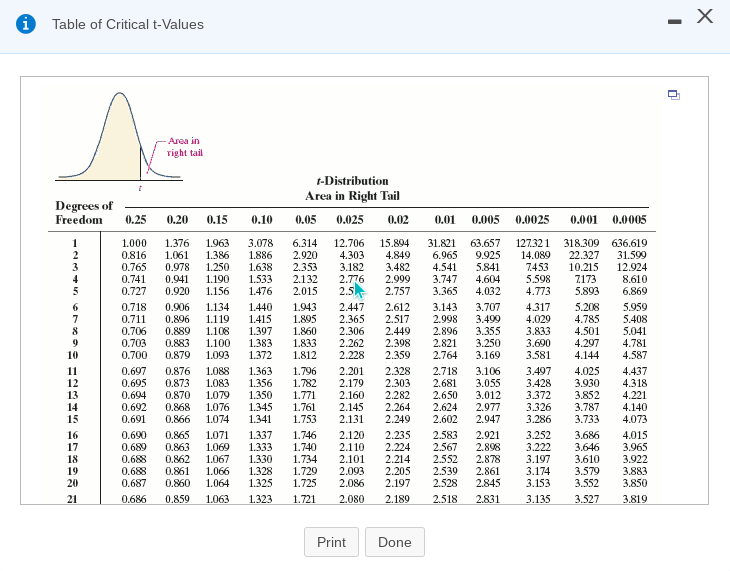

Transcribed Image Text:Table of Critical t-Values
Area in
right tail
t-Distribution
Area in Right Tail
Degrees of
Freedom
0.25
0.20
0.15
0.10
0.05
0.025
0.02
0.01
0.005 0.0025
0.001 0.0005
1.963
3.078
6.314
1
2
3
1.000
0.816
0.765
0.741
0.727
1.376
1.061
0.978
0.941
0.920
1.386
1.250
1.190
1.156
1.886
1.638
1.533
1.476
2.920
2.353
2.132
2.015
12.706
4.303
3.182
15.894
4.849
3.482
2.999
31.821
6.965
4.541
3.747
3.365
63.657
9.925
5.841
4.604
4.032
127.321
14.089
7.453
5.598
318.309 636.619
31.599
12.924
8.610
6.869
22.327
10.215
2.776
2.5
7173
5.893
5
2.757
4.773
2.447
2.365
3.143
2.998
2.896
2.821
2.764
6
7
8
0.718
0.711
0.706
0.703
0.700
0.906
0.896
0.889
0.883
0.879
1.134
1.119
1.108
1.100
1.093
1.440
1.415
1.397
1.383
1.372
1.943
1.895
1.860
1.833
1.812
2.306
2.262
2.228
2.612
2.517
2.449
2.398
2.359
3.707
3.499
3.355
3.250
3.169
4.317
4.029
3.833
3.690
3.581
5.208
4.785
5.959
5.408
5.041
4.781
4.587
4.501
4.297
10
4.144
0.697
11
12
13
14
15
0.876
0.873
0.870
0.868
0.866
1.088
1.083
1.079
1.076
1.074
1.363
1.356
1.350
1.345
1.341
1.796
1.782
0.695
0.694
0.692
1.771
1.761
1.753
2.201
2.179
2.160
2.145
2.131
2.328
2.303
2.282
2.264
2.249
2.718
2.681
2.650
2.624
2.602
3.106
3.055
3.012
3.497
3.428
3.372
3.326
4.025
3.930
3.852
3.787
4.437
4.318
4.221
4.140
4.073
2.977
2.947
0.691
3.286
3.733
0.690
0.689
0.688
0.688
0.687
2.235
2.224
2.214
2.205
2.197
3.252
16
17
18
19
20
0.865
0.863
0.862
0.861
0.860
1.071
1.069
1.067
1.066
1.064
1.337
1.333
1.330
1.328
1.325
1.746
1.740
1.734
1.729
1.725
2.120
2.110
2.101
2.093
2.086
2.583
2.567
2.552
2.539
2.528
2.921
2.898
2.878
2.861
2.845
3.222
3.197
3.174
3.153
3.686
3.646
3.610
3.579
3.552
4.015
3.965
3.922
3.883
3.850
21
0.686
0.859
1.063
1.323
1.721
2.080
2.189
2.518
2.831
3.135
3.527
3.819
Print
Done

Transcribed Image Text:A survey was conducted that asked 1012 people how many books they had read in the past year. Results indicated that x = 11.4 books and s = 16.6 books. Construct a 95% confidence interval for the mean number of books people
read. Interpret the interval.
E Click the icon to view the table of critical t-values.
Construct a 95% confidence interval for the mean number of books people read and interpret the result. Select the correct choice below and fill in the answer boxes to complete your choice.
(Use ascending order. Round to two decimal places as needed.)
O A. If repeated samples are taken, 95% of them will have a sample mean between
and
O B. There is a 95% probability that the true mean number of books read is between
and
O C. There is 95% confidence that the population mean number of books read is between
and
Expert Solution
This question has been solved!
Explore an expertly crafted, step-by-step solution for a thorough understanding of key concepts.

This is a popular solution

Trending nowThis is a popular solution!

Step by stepSolved in 2 steps with 1 images

Knowledge Booster


Learn more about
Need a deep-dive on the concept behind this application? Look no further. Learn more about this topic, statistics and related others by exploring similar questions and additional content below.Similar questions
- A survey was conducted that asked 1016 people how many books they had read in the past year. Results indicated that x = 13.3 books and s= 16.6 books. Construct a 90% confidence interval for the mean number of books people read. Interpret the interval. Click the icon to view the table of critical t-values. Construct a 90% confidence interval for the mean number of books people read and interpret the result. Select the correct choice below and fill in the answer boxes to complete your choice. (Use ascending order. Round to two decimal places as needed.) OA. If repeated samples are taken, 90% of them will have a sample mean between and OB. There is 90% confidence that the population mean number of books read is between and OC. There is a 90% probability that the true mean number of books read is between andarrow_forwardYou must estimate the mean. 60, 59.3, 49.7, 23.9, 44, 39.4, 85.2, 46 mean = 50.9375Find the 98% confidence interval. Enter your answer as an open interval (i.e. parentheses) accurate to two decimal places.arrow_forwardSubject; stetesticarrow_forward
- A survey was conducted that asked 1009 people how many books they had read in the past year. Results indicated that x = 14.4 books and s= 16.6 books. Construct a 90% confidence interval for the mean number of books people read. Interpret the interval. Click the icon to view the table of critical t-values. C Construct a 90% confidence interval for the mean number of books people read and interpret the result. Select the correct choice below and fill in the answer boxes to complete your choice. (Use ascending order. Round to two decimal places as needed.) OA. If repeated samples are taken, 90% of them will have a sample mean between and H OB. There is a 90% probability that the true mean number of books read is between and OC. There is 90% confidence that the population mean number of books read is between andarrow_forwardIn a sample of 500 Canadians, it was found that 400 people preferred apple products. In a sample of 700 Americans it was found that 600 preferred apple products. Is the proportion Canadians who prefer apple products less than Americans. 1. Construct 95% confidence interval for difference of proportions. 2. From the confidence interval, do you think that the proportion of Canadians who prefer apple products is different from Americans.arrow_forwardA random sample of 64 shoppers showed that they spend an average of $27.31 per visit at the Sunday Mornings Bookstore. The standard deviation of the population is $2.14. Find the 90% confidence interval of the true mean. Please include all work showing how you found your answer.arrow_forward
- A survey was conducted that asked 1018 people how many books they had read in the past year. Results indicated that x = 14.3 books and s= 16.6 books. Construct a 90% confidence interval for the mean number of books people read. Interpret the interval. Click the icon to view the table of critical t-values. Construct a 90% confidence interval for the mean number of books people read and interpret the result. Select the correct choice below and fill in the answer boxes to complete your choice. (Use ascending order. Round to two decimal places as needed.) OA. If repeated samples are taken, 90% of them will have a sample mean between and OB. There is 90% confidence that the population mean number of books read is between OC. There is a 90% probability that the true mean number of books read is between and andarrow_forwardA survey was conducted that asked 1016 people how many books they had read in the past year. Results indicated that x = 11.8 books and s = 16.6 books. Construct a 99% confidence interval for the mean number of books people read. Interpret the interval. E Click the icon to view the table of critical t-values. Construct a 99% confidence interval for the mean number of books people read and interpret the result. Select the correct choice below and fill in the answer boxes to complete vour choice. (Use ascending order. Round to two decimal places as needed.) O A. If repeated samples are taken, 99% of them will have a sample mean between and. Table of Critical t-Values O B. There is a 99% probability that the true mean number of books read is between and. OC. There is 99% confidence that the population mean number of books read is between and . t-Distribution Area in Right Tail Degrees of Freedom 0.25 0.20 0.15 0.10 0025 00 0.01 0.005 0.0025 0.001 0.0005 1.376 1.963 1.061 1.386 0.978 1.250…arrow_forward
arrow_back_ios
arrow_forward_ios
Recommended textbooks for you
- MATLAB: An Introduction with ApplicationsStatisticsISBN:9781119256830Author:Amos GilatPublisher:John Wiley & Sons Inc
 Probability and Statistics for Engineering and th...StatisticsISBN:9781305251809Author:Jay L. DevorePublisher:Cengage Learning
 Statistics for The Behavioral Sciences (MindTap C...StatisticsISBN:9781305504912Author:Frederick J Gravetter, Larry B. WallnauPublisher:Cengage Learning
  Elementary Statistics: Picturing the World (7th E...StatisticsISBN:9780134683416Author:Ron Larson, Betsy FarberPublisher:PEARSON
 The Basic Practice of StatisticsStatisticsISBN:9781319042578Author:David S. Moore, William I. Notz, Michael A. FlignerPublisher:W. H. Freeman
 Introduction to the Practice of StatisticsStatisticsISBN:9781319013387Author:David S. Moore, George P. McCabe, Bruce A. CraigPublisher:W. H. Freeman
MATLAB: An Introduction with Applications
Statistics
ISBN:9781119256830
Author:Amos Gilat
Publisher:John Wiley & Sons Inc
Probability and Statistics for Engineering and th...
Statistics
ISBN:9781305251809
Author:Jay L. Devore
Publisher:Cengage Learning
Statistics for The Behavioral Sciences (MindTap C...
Statistics
ISBN:9781305504912
Author:Frederick J Gravetter, Larry B. Wallnau
Publisher:Cengage Learning
Elementary Statistics: Picturing the World (7th E...
Statistics
ISBN:9780134683416
Author:Ron Larson, Betsy Farber
Publisher:PEARSON
The Basic Practice of Statistics
Statistics
ISBN:9781319042578
Author:David S. Moore, William I. Notz, Michael A. Fligner
Publisher:W. H. Freeman
Introduction to the Practice of Statistics
Statistics
ISBN:9781319013387
Author:David S. Moore, George P. McCabe, Bruce A. Craig
Publisher:W. H. Freeman