
MATLAB: An Introduction with Applications
6th Edition
ISBN: 9781119256830
Author: Amos Gilat
Publisher: John Wiley & Sons Inc
expand_more
expand_more
format_list_bulleted
Related questions
Question
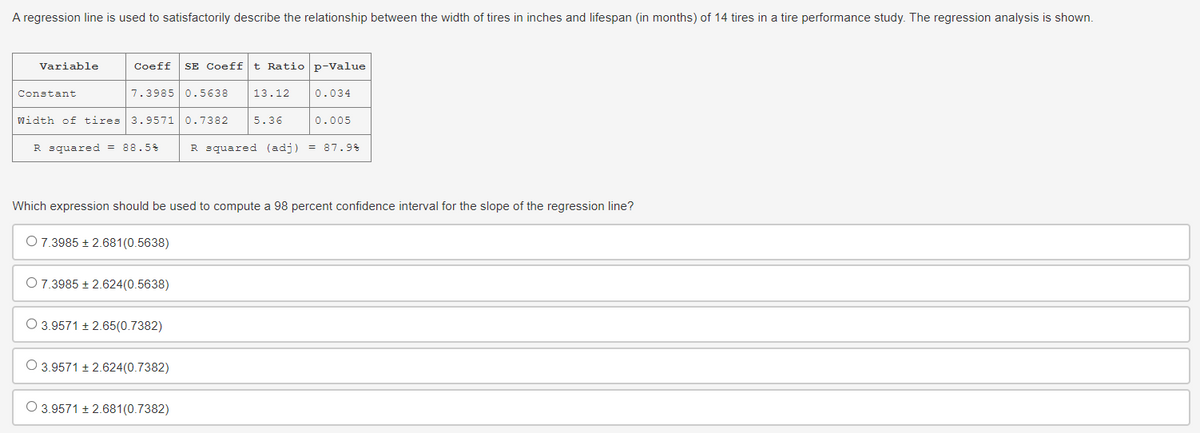

Transcribed Image Text:A regression line is used to satisfactorily describe the relationship between the width of tires in inches and lifespan (in months) of 14 tires in a tire performance study. The regression analysis is shown.
Variable
Constant
Coeff SE Coefft Ratio p-Value
7.3985 0.5638 13.12
Width of tires 3.9571
3.9571 0.7382
R squared = 88.5%
O 7.3985 ± 2.624(0.5638)
O 3.9571±2.65(0.7382)
O 3.9571±2.624(0.7382)
5.36
Which expression should be used to compute a 98 percent confidence interval for the slope of the regression line?
O 7.3985 +2.681(0.5638)
O 3.9571 +2.681(0.7382)
0.034
0.005
R squared (adj) = 87.9%
Expert Solution
This question has been solved!
Explore an expertly crafted, step-by-step solution for a thorough understanding of key concepts.

Step by stepSolved in 3 steps with 12 images

Knowledge Booster

Similar questions
- Find the regression equation, letting overhead width be the predictor (x) variable. Find the best predicted weight of a seal if the overhead width measured from a photograph is 2 cm. Can the prediction be correct? What is wrong with predicting the weight in this case? Use a significance level of 0.05. Overhead Width (cm) 7.9 8.4 9.7 7.4 9.6 7.1 Weight (kg) 162 214 263 140 254 155 Click the icon to view the critical values of the Pearson correlation coefficient r. The regression equation is y = + x. (Round to one decimal place as needed.) The best predicted weight for an overhead width of 2 cm is kg. (Round to one decimal place as needed.) Can the prediction be correct? What is wrong with predicting the weight in this case? O A. The prediction cannot be correct because a negative weight does not make sense. The width in this case is beyond the scope of the available sample data. O B. The prediction cannot be correct because there is not sufficient evidence of a linear correlation. The…arrow_forwardI need help finding the answers for A,B,and Carrow_forwardThe null hypothesis: H, :0 H :0 The alternative hypothesis: Н The type of test statistic: (Choose one) v The value of the test statistic: (Round to at least three decimal places.) The critical value at the 0.05 level of significance: (Round to at least three decimal places.) Can we conclude that houses in Sun Beach have higher appreciation over the past three years than houses in North Arden? Yes Noarrow_forward
- only HANDWRITTEN answer needed ( NOT TYPED)arrow_forwardThe table shows a part of an output of a linear regression model predicting the average fare on different flight routes. Data Table Regression Table Coefficient Constant 95.80976147 COUPON −9.61654124 DISTANCE 0.080733811 PAX −0.000167343 What is the difference in prediction of the following two routes? Route A that is 3,000 miles, with COUPON=1.5 and PAX=6,000 Route B that is 3,000 miles, with COUPON=1.2 and PAX=6,000.arrow_forwardUse the value of the linear correlation coefficient to calculate the coefficient of determination. What does this tell you about the explained variation of the data about the regression line? About the unexplained variation? r=0.926arrow_forward
- The best predicted circumference for a diameter 1.2 cm is?arrow_forwardA regression was run to determine if there is a relationship between hours of TV watched per day (x) and number of situps a person can do (y). The results of the regression were: y=ax+b a=-1.271 b=39.101 ²-0.407044 r=-0.638 Assume the correlation is significant, and use this to predict the number of situps a person who watches 14 hours of TV can do (to one decimal place) Aftarrow_forwardFind the regression equation, letting overhead width be the predictor (x) variable. Find the best predicted weight of a seal if the overhead width measured from a photograph is 2.1 cm. Can the prediction be correct? What is wrong with predicting the weight in this case? Use a significance level of 0.05. Overhead Width (cm) 8.1 7.6 8.9 7.7 8.6 9.8 Weight (kg) 156 166 213 138 197 251 Click the icon to view the critical values of the Pearson correlation coefficient r. The regression equation is y = (Round to one decimal place as needed.)arrow_forward
- A sales manager for an advertising agency believes there is a relationship between the number of contacts that a salesperson makes and the amount of sales dollars earned. A regression analysis shows the following results. Coefficients Standard Error t-Stat p-value Intercept −12.201 6.560 −1.860 0.100 Number of contacts 2.195 0.176 12.505 0.000 What is the regression equation? Multiple Choice Ŷ = 2.195 − 12.201X Ŷ = −12.201 + 2.195X Ŷ = 12.201 + 2.195X Ŷ = 2.195 + 12.201Xarrow_forwardAn experiment is run. The mass of an object is recorded over time. Time (min) Mass (g) 32 40 36 32 37 32 39 30 50 27 Using your calculator, run a linear regression to determine the equation of the line of best fit. Round to two decimal places, use x for the variable.y=Using your equation, estimate the mass of the object at 41 minutes.grams=arrow_forwardThe following data gives the number of employees at the bookstore and the number of minutes students wait in line to buy books at the beginning of the term. The independent variable is the number of employees and the dependent variable is the number of minutes. What is the y intercept? SSxx = 56.857; SS=2095.714; SSxy=-322.571 SUMMARY OUTPUT Regression Statistics Multiple R R Square Adjusted R Square XA356899 0.96 0.93 0.91 y 67 54 47 33 31 25 12arrow_forward
arrow_back_ios
SEE MORE QUESTIONS
arrow_forward_ios
Recommended textbooks for you
- MATLAB: An Introduction with ApplicationsStatisticsISBN:9781119256830Author:Amos GilatPublisher:John Wiley & Sons Inc
 Probability and Statistics for Engineering and th...StatisticsISBN:9781305251809Author:Jay L. DevorePublisher:Cengage Learning
 Statistics for The Behavioral Sciences (MindTap C...StatisticsISBN:9781305504912Author:Frederick J Gravetter, Larry B. WallnauPublisher:Cengage Learning
  Elementary Statistics: Picturing the World (7th E...StatisticsISBN:9780134683416Author:Ron Larson, Betsy FarberPublisher:PEARSON
 The Basic Practice of StatisticsStatisticsISBN:9781319042578Author:David S. Moore, William I. Notz, Michael A. FlignerPublisher:W. H. Freeman
 Introduction to the Practice of StatisticsStatisticsISBN:9781319013387Author:David S. Moore, George P. McCabe, Bruce A. CraigPublisher:W. H. Freeman
MATLAB: An Introduction with Applications
Statistics
ISBN:9781119256830
Author:Amos Gilat
Publisher:John Wiley & Sons Inc
Probability and Statistics for Engineering and th...
Statistics
ISBN:9781305251809
Author:Jay L. Devore
Publisher:Cengage Learning
Statistics for The Behavioral Sciences (MindTap C...
Statistics
ISBN:9781305504912
Author:Frederick J Gravetter, Larry B. Wallnau
Publisher:Cengage Learning
Elementary Statistics: Picturing the World (7th E...
Statistics
ISBN:9780134683416
Author:Ron Larson, Betsy Farber
Publisher:PEARSON
The Basic Practice of Statistics
Statistics
ISBN:9781319042578
Author:David S. Moore, William I. Notz, Michael A. Fligner
Publisher:W. H. Freeman
Introduction to the Practice of Statistics
Statistics
ISBN:9781319013387
Author:David S. Moore, George P. McCabe, Bruce A. Craig
Publisher:W. H. Freeman