
MATLAB: An Introduction with Applications
6th Edition
ISBN: 9781119256830
Author: Amos Gilat
Publisher: John Wiley & Sons Inc
expand_more
expand_more
format_list_bulleted
Related questions
Concept explainers
Question
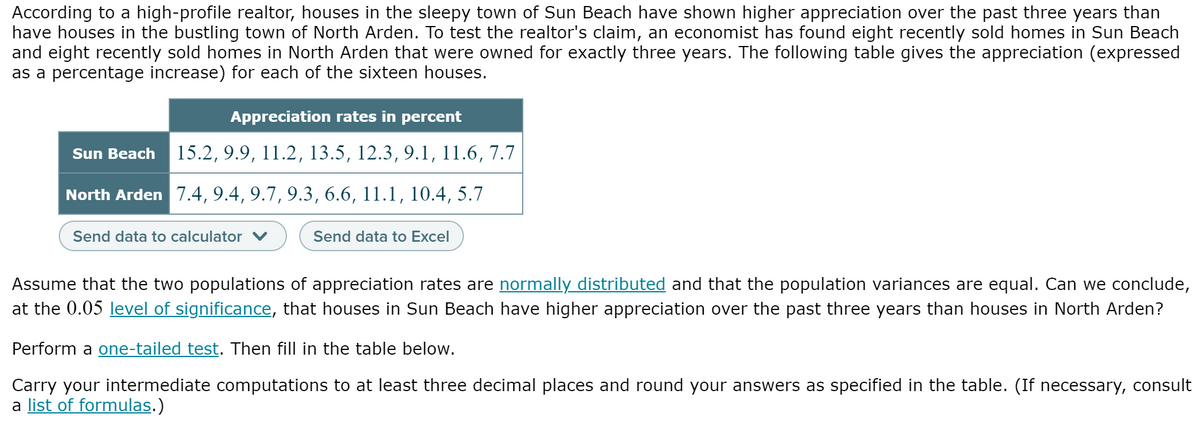

Transcribed Image Text:According to a high-profile realtor, houses in the sleepy town of Sun Beach have shown higher appreciation over the past three years than
have houses in the bustling town of North Arden. To test the realtor's claim, an economist has found eight recently sold homes in Sun Beach
and eight recently sold homes in North Arden that were owned for exactly three years. The following table gives the appreciation (expressed
as a percentage increase) for each of the sixteen houses.
Appreciation rates in percent
Sun Beach 15.2, 9.9, 11.2, 13.5, 12.3, 9.1, 11.6, 7.7
North Arden 7.4, 9.4, 9.7, 9.3,6.6, 11.1, 10.4, 5.7
Send data to calculator v
Send data to Excel
Assume that the two populations of appreciation rates are normally distributed and that the population variances are equal. Can we conclude,
at the 0.05 level of significance, that houses in Sun Beach have higher appreciation over the past three years than houses in North Arden?
Perform a one-tailed test. Then fill in the table below.
Carry your intermediate computations to at least three decimal places and round your answers as specified in the table. (If necessary, consult
a list of formulas.)

Transcribed Image Text:The null hypothesis:
H, :0
H :0
The alternative hypothesis:
Н
The type of test statistic:
(Choose one) v
The value of the test statistic:
(Round to at least three
decimal places.)
The critical value at the 0.05
level of significance:
(Round to at least three
decimal places.)
Can we conclude that houses in Sun Beach have
higher appreciation over the past three years than
houses in North Arden?
Yes
No
Expert Solution
This question has been solved!
Explore an expertly crafted, step-by-step solution for a thorough understanding of key concepts.

Step by stepSolved in 5 steps

Knowledge Booster


Learn more about
Need a deep-dive on the concept behind this application? Look no further. Learn more about this topic, statistics and related others by exploring similar questions and additional content below.Similar questions
- mg We want to conduct a hypothesis test of the claim that for middle-aged adults the population mean of their cholesterol levels is more than 202 We choose mg and a standard deviation of 19 dL mg a random sample of such levels. The sample has a mean of 197 For each of the following sampling scenarios, choose an appropriate test statistic for our hypothesis test on the population mean. Then calculate that statistic. Round your answers to two decimal places. Aa (a) The sample has size 16, and it is from a normally distributed population with a known standard deviation of 19.3. O z = O t = O It is unclear which test statistic to use. (b) The sample has size 17, and it is from a normally distributed population with an unknown standard deviation. O z = O t = O It is unclear which test statistic to use.arrow_forwardPlz help me with this problem, I don’t understandarrow_forwardTest the claim that the mean GPA of night students is smaller than 2.2 at the .10 significance level. Based on a sample of 45 people, the sample mean GPA was 2.16 with a standard deviation of 0.06The test statistic is: (to 2 decimals)The critical value is: (to 2 decimals)arrow_forward
- You would like to estimate the variance of sick days at a Fortune 500 company. You randomly select 15 employees and record how many sick days they have used in the past year and you get a sample standard deviation of 1.2. Provide a 95% confidence interval estimate of the population variance.arrow_forwardNonearrow_forwardTest the claim that the mean GPA of night students is significantly different than 2.8 at the 0.1 significance level. Based on a sample of 70 people, the sample mean GPA was 2.81 with a standard deviation of 0.03 The positive critical value is: (to 2 decimals)arrow_forward
- A publisher reports that 69 % of their readers own a particular make of car. A marketing executive wants to test the claim that the percentage is actually under the reported percentage. A random sample of 200 found that 60% of the readers owned a particular make of car. Is there sufficient evidence at the 0.10 level to support the executive's claim? Step 4 of 7: Determine the P-value of the test statistic. Round your answer to four decimal places.arrow_forwardhw Q 4arrow_forwardPlz help because I don’t understand this problemarrow_forward
arrow_back_ios
arrow_forward_ios
Recommended textbooks for you
- MATLAB: An Introduction with ApplicationsStatisticsISBN:9781119256830Author:Amos GilatPublisher:John Wiley & Sons Inc
 Probability and Statistics for Engineering and th...StatisticsISBN:9781305251809Author:Jay L. DevorePublisher:Cengage Learning
 Statistics for The Behavioral Sciences (MindTap C...StatisticsISBN:9781305504912Author:Frederick J Gravetter, Larry B. WallnauPublisher:Cengage Learning
  Elementary Statistics: Picturing the World (7th E...StatisticsISBN:9780134683416Author:Ron Larson, Betsy FarberPublisher:PEARSON
 The Basic Practice of StatisticsStatisticsISBN:9781319042578Author:David S. Moore, William I. Notz, Michael A. FlignerPublisher:W. H. Freeman
 Introduction to the Practice of StatisticsStatisticsISBN:9781319013387Author:David S. Moore, George P. McCabe, Bruce A. CraigPublisher:W. H. Freeman
MATLAB: An Introduction with Applications
Statistics
ISBN:9781119256830
Author:Amos Gilat
Publisher:John Wiley & Sons Inc
Probability and Statistics for Engineering and th...
Statistics
ISBN:9781305251809
Author:Jay L. Devore
Publisher:Cengage Learning
Statistics for The Behavioral Sciences (MindTap C...
Statistics
ISBN:9781305504912
Author:Frederick J Gravetter, Larry B. Wallnau
Publisher:Cengage Learning
Elementary Statistics: Picturing the World (7th E...
Statistics
ISBN:9780134683416
Author:Ron Larson, Betsy Farber
Publisher:PEARSON
The Basic Practice of Statistics
Statistics
ISBN:9781319042578
Author:David S. Moore, William I. Notz, Michael A. Fligner
Publisher:W. H. Freeman
Introduction to the Practice of Statistics
Statistics
ISBN:9781319013387
Author:David S. Moore, George P. McCabe, Bruce A. Craig
Publisher:W. H. Freeman