
MATLAB: An Introduction with Applications
6th Edition
ISBN: 9781119256830
Author: Amos Gilat
Publisher: John Wiley & Sons Inc
expand_more
expand_more
format_list_bulleted
Related questions
Concept explainers
Question
thumb_up100%
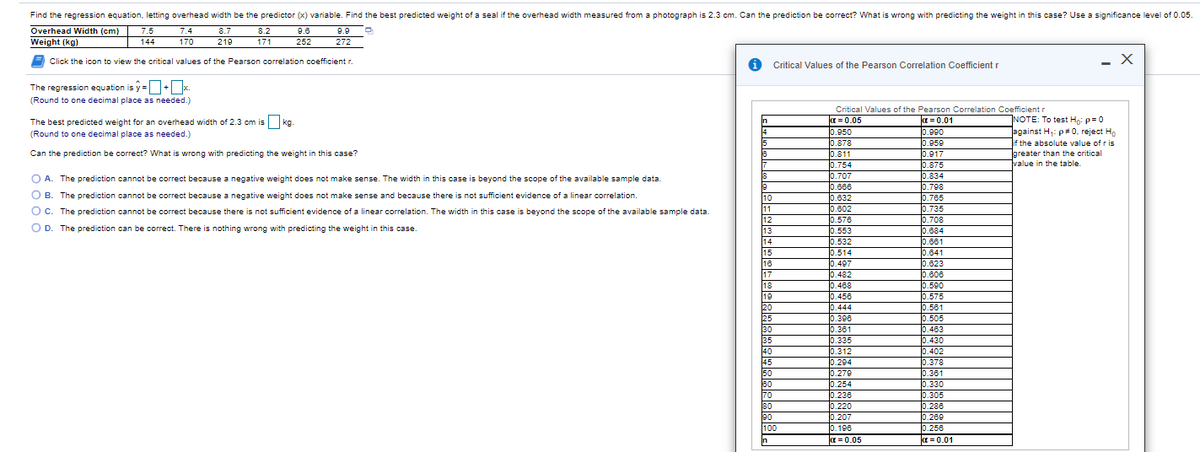
Find the regression equation, letting overhead width be the predictor (x) variable. Find the best predicted weight of a seal if the overhead width measured from a photograph is 2.3 cm.
Can the prediction be correct? What is wrong with predicting the weight in this case? Use a significance level of 0.05.
The regression equation is
y=___+___x
(Round to one decimal place as needed.)
The best predicted weight for an overhead width of
2.3cm is ___kg.
(Round to one decimal place as needed.)
Can the prediction be correct? What is wrong with predicting the weight in this case?

Transcribed Image Text:Find the regression equation, letting overhead width be the predictor (x) variable. Find the best predicted weight of a seal if the overhead width measured from a photograph is 2.3 cm. Can the prediction be correct? What is wrong with predicting the weight in this case? Use a significance level of 0.05.
Overhead Width (cm)
7.5
7.4
8.7
8.2
9.6
9.9
Weight (kg)
144
170
219
171
252
272
Click the icon to view the critical values of the Pearson correlation coefficient r.
Critical Values of the Pearson Correlation Coefficient r
The regression equation is y =+x.
(Round to one decimal place as needed.)
Critical Values of the Pearson Correlation Coefficient r
NOTE: To test Ho: p=0
against H,: p# 0, reject H
if the absolute value of r is
greater than the critical
value in the table.
In
a = 0.05
0.950
0.878
0.811
0.754
0.707
0.668
0.632
0.602
0.576
0.553
0.532
0.514
0.497
0.482
0.488
0.456
0.444
0.398
0.361
0.335
0.312
0.294
0.279
0.254
0.236
0.220
0.207
0.196
a = 0.05
a = 0.01
0.990
0.950
0.917
0.875
0.834
0.708
0.765
0.735
0.708
0.684
0.661
0.641
0.623
0.806
0.590
0.575
0.561
0.505
0.483
0.430
0.402
0.378
0.361
0.330
0.305
0.288
0.269
0.256
a = 0.01
The best predicted weight for an overhead width of 2.3 cm is kg.
14
(Round to one decimal place as needed.)
15
Can the prediction be correct? What is wrong with predicting the weight in this case?
18
17
O A. The prediction cannot be correct because a negative weight does not make sense. The width in this case is beyond the scope of the available sample data.
O B. The prediction cannot be correct because a negative weight does not make sense and because there is not sufficient evidence of a linear correlation.
10
11
12
13
14
O c. The prediction cannot be correct because there is not sufficient evidence of a linear correlation. The width in this case is beyond the scope of the available sample data.
O D. The prediction can be correct. There is nothing wrong with predicting the weight in this case
15
16
17
18
19
20
25
30
35
40
45
50
80
70
80
90
100
In
Expert Solution
This question has been solved!
Explore an expertly crafted, step-by-step solution for a thorough understanding of key concepts.

This is a popular solution

Trending nowThis is a popular solution!

Step by stepSolved in 3 steps

Knowledge Booster


Learn more about
Need a deep-dive on the concept behind this application? Look no further. Learn more about this topic, statistics and related others by exploring similar questions and additional content below.Similar questions
- Find the regression equation, letting overhead width be the predictor (x) variable. Find the best predicted weight of a seal if the overhead width measured from a photograph is 2 cm. Can the prediction be correct? What is wrong with predicting the weight in this case? Use a significance level of 0.05. Overhead Width (cm) 7.9 8.4 9.7 7.4 9.6 7.1 Weight (kg) 162 214 263 140 254 155 Click the icon to view the critical values of the Pearson correlation coefficient r. The regression equation is y = + x. (Round to one decimal place as needed.) The best predicted weight for an overhead width of 2 cm is kg. (Round to one decimal place as needed.) Can the prediction be correct? What is wrong with predicting the weight in this case? O A. The prediction cannot be correct because a negative weight does not make sense. The width in this case is beyond the scope of the available sample data. O B. The prediction cannot be correct because there is not sufficient evidence of a linear correlation. The…arrow_forwardThe accompanying data are the length (in centimeters) and girths (in centimeters) of 12 harbor seals. Find the equation of the regression line. Then construct a scatter plot of the data and draw the regression line. Then use the regression equation to predict the value of y for each of the given x-values, if meaningful. If the x-value is not meaningful to predict the value of y, explain why not. (a) x= 140 cm E Click the icon to view the table of lengths and girths. (b) x= 172 cm (c) x= 164 cm (d) x= 158 cm The equation of the regression line is y=x+ (Round to two decimal places as needed.) Construct a scatter plot of the data and draw the regression line. Plot length on the horizontal axis and girth on the vertical axis. Choose the correct graph below. O A. OB. Oc. OD. Q 140 140 140 140 100 100 100 100 120 180 120 160 120 180 120 180 (a) Predict the girth for a length of 140 cm, if it is meaningful. Select the correct choice below and, if necessary, fill in the answer box within your…arrow_forward(2 Find the regression equation, letting the diameter be the predictor (x) variable. Find the best predicted circumference of a marble with a diameter of 1.2 cm. How does the result compare to the actual circumference of 3.8 cm? Use a significance level of 0.05. Baseball Basketball Golf Soccer Tennis Ping-Pong Volleyball Diameter 7.5 24.2 4.4 21.7 6.9 4.0 21.4 Circumference 23.6 76.0 13.8 68.2 21.7 12.6 67.2 Click the icon to view the critical values of the Pearson correlation coefficient r. The regression equation is y=+x. (Round to five decimal places as needed.) The best predicted circumference for a diameter of 1.2 cm is cm. (Round to one decimal place as needed.) How does the result compare to the actual circumference of 3.8 cm? O A. Since 1.2 cm is beyond the scope of the sample diameters, the predicted value yields a very different circumference. O B. Even though 1.2 cm is within the scope of the sample diameters, the predicted value yields a very different circumference. O C.…arrow_forward
- The data show the chest size and weight of several bears. Find the regression equation, letting chest size be the independent (x) variable. Then find the best predicted weight of a bear with a chest size of 40inches. Is the result close to the actual weight of 352pounds? Use a significance level of 0.05.a. Chest size (inches) 41 54 44 55 39 51 Weight (pounds) 328 528 418 580 296 503 a.What is the regression equation? b. The best predicted weight for a bear with a chest size of 39 inches is _______pounds. arrow_forwardThe data show the chest size and weight of several bears. Find the regression equation, letting chest size be the independent (x) variable. Then find the best predicted weight of a bear with a chest size of 58 inches. Is the result close to the actual weight of 572 pounds? Use a significance level of 0.05. Chest size (inches) 46 57 53 41 40 40 Weight (pounds) 384 580 542 358 306 320 LOADING... Click the icon to view the critical values of the Pearson correlation coefficient r. What is the regression equation? y=nothing+nothingx (Round to one decimal place as needed.)arrow_forwardA regression was run to determine if there is a relationship between hours of TV watched per day (x) and number of situps a person can do (y). The results of the regression were: y=ax+b a=-1.204 b=27.142 r2=0.910116 r=-0.954 Use this to predict the number of situps a person who watches 7 hour(s) of TV can do, and please round your answer to a whole number. Question Help: Message instructor Submit Question 用 hp -> DII 23 2$ 3. 4 6. 7. 8 y k farrow_forward
- The best predicted circumference for a diameter 1.2 cm is?arrow_forwardA regression was run to determine if there is a relationship between hours of TV watched per day (x) and number of situps a person can do (y). The results of the regression were: y=a+bx b=-0.66 a=25.376 r²=0.390625 r=-0.625 Use this to predict the number of situps a person who watches 2.5 hours of TV can do. place. Round to one decimalarrow_forwardFind the regression equation, letting overhead width be the predictor (x) variable. Find the best predicted weight of a seal if the overhead width measured from a photograph is 2.1 cm. Can the prediction be correct? What is wrong with predicting the weight in this case? Use a significance level of 0.05. Overhead Width (cm) 8.1 7.6 8.9 7.7 8.6 9.8 Weight (kg) 156 166 213 138 197 251 Click the icon to view the critical values of the Pearson correlation coefficient r. The regression equation is y = (Round to one decimal place as needed.)arrow_forward
- The data show the chest size and weight of several bears. Find the regression equation, letting chest size be the independent (x) variable. Then find the best predicted weight of a bear with a chest size of 40 inches. Is the result close to the actual weight of 352 pounds? Use a significance level of 0.05. Chest size (inches) *Weight (pounds) 44 54 328 528 41 55 39 51 418 580 296 503 Click the icon to view the critical values of the Pearson correlation coefficient r. - What is the regression equation? x (Round to one decimal place as needed.)arrow_forwardFind the regression equation, letting overhead width be the predictor (x) variable. Find the best predicted weight of a seal if the overhead width measured from a photograph is 2.3 cm. Can the prediction be correct? What is wrong with predicting the weight in this case? Use a significance level of 0.05. Overhead Width (cm) Weight (kg) 7.8 175 7.3 9.5 274 7.4 156 9.9 294 9.2 183 256 Click the icon to view the critical values of the Pearson correlation coefficient r. ..... The regression equation is y =+x. (Round to one decimal place as needed.)arrow_forwardListed below are the overhead widths (cm) of seals measured from photographs and weights (kg) of the seals. Find the regression equation, letting the overhead width be the predictor (x) variable. Find the best predicted weight of a seal if the overhead width measured from a photograph is 1.8 cm, using the regression equation. Can the prediction be correct? If not, what is wrong? Use a significance level of 0.05. Overhead Width (cm) 7.3 7.4 9.8 9.5 8.8 8.5 Weight (kg) 152 187 286 247 237 231 The regression equation is y =+ (x. (Round the y-intercept to the nearest integer as needed. Round the slope to one decimal place as needed.)arrow_forward
arrow_back_ios
SEE MORE QUESTIONS
arrow_forward_ios
Recommended textbooks for you
- MATLAB: An Introduction with ApplicationsStatisticsISBN:9781119256830Author:Amos GilatPublisher:John Wiley & Sons Inc
 Probability and Statistics for Engineering and th...StatisticsISBN:9781305251809Author:Jay L. DevorePublisher:Cengage Learning
 Statistics for The Behavioral Sciences (MindTap C...StatisticsISBN:9781305504912Author:Frederick J Gravetter, Larry B. WallnauPublisher:Cengage Learning
  Elementary Statistics: Picturing the World (7th E...StatisticsISBN:9780134683416Author:Ron Larson, Betsy FarberPublisher:PEARSON
 The Basic Practice of StatisticsStatisticsISBN:9781319042578Author:David S. Moore, William I. Notz, Michael A. FlignerPublisher:W. H. Freeman
 Introduction to the Practice of StatisticsStatisticsISBN:9781319013387Author:David S. Moore, George P. McCabe, Bruce A. CraigPublisher:W. H. Freeman
MATLAB: An Introduction with Applications
Statistics
ISBN:9781119256830
Author:Amos Gilat
Publisher:John Wiley & Sons Inc
Probability and Statistics for Engineering and th...
Statistics
ISBN:9781305251809
Author:Jay L. Devore
Publisher:Cengage Learning
Statistics for The Behavioral Sciences (MindTap C...
Statistics
ISBN:9781305504912
Author:Frederick J Gravetter, Larry B. Wallnau
Publisher:Cengage Learning
Elementary Statistics: Picturing the World (7th E...
Statistics
ISBN:9780134683416
Author:Ron Larson, Betsy Farber
Publisher:PEARSON
The Basic Practice of Statistics
Statistics
ISBN:9781319042578
Author:David S. Moore, William I. Notz, Michael A. Fligner
Publisher:W. H. Freeman
Introduction to the Practice of Statistics
Statistics
ISBN:9781319013387
Author:David S. Moore, George P. McCabe, Bruce A. Craig
Publisher:W. H. Freeman