MATLAB: An Introduction with Applications
6th Edition
ISBN: 9781119256830
Author: Amos Gilat
Publisher: John Wiley & Sons Inc
expand_more
expand_more
format_list_bulleted
Question

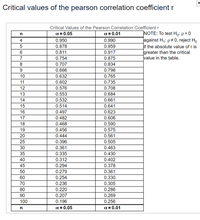
Transcribed Image Text:Critical values of the pearson correlation coefficient r
Critical Values of the Pearson Correlation Coefficientr
x = 0.05
x = 0.01
INOTE: To test Ho: p=0
n
Jagainst H,: p#0, reject Ho
if the absolute value of r is
greater than the critical
value in the table.
4
0.950
0.990
0.878
0.959
0.811
0.917
7
0.754
0.875
8
0.707
0.834
9.
0.666
0.798
10
0.632
0.765
11
0.602
0.735
12
0.576
0.708
13
0.553
0.684
14
0.532
0.661
15
0.514
0.641
16
0.497
0.623
17
0.482
0.606
18
0.468
0.590
19
0.456
0.575
20
0.444
0.561
25
0.396
0.505
30
0.361
0.463
35
0.335
0.430
40
0.312
0.402
45
0.294
0.378
50
0.279
0.361
60
0.254
0.330
70
0.236
0.305
80
0.220
0.286
90
0.207
0.269
100
0.196
0.256
a = 0.05
X = 0.01

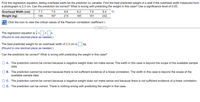
Transcribed Image Text:Find the regression equation, letting overhead width be the predictor (x) variable. Find the best predicted weight of a seal if the overhead width measured from
a photograph is 2.3 cm. Can the prediction be correct? What is wrong with predicting the weight in this case? Use a significance level of 0.05.
Overhead Width (cm)
7.7
7.5
8.8
8.2
7.6
9.4
Weight (kg)
146
167
215
165
161
242
Click the icon to view the critical values of the Pearson correlation coefficient r.
The regression equation is y = + x
X.
(Round to one decimal place as needed.)
The best predicted weight for an overhead width of 2.3 cm is
kg.
(Round to one decimal place as needed.)
Can the prediction be correct? What is wrong with predicting the weight in this case?
O A. The prediction cannot be correct because a negative weight does not make sense. The width in this case is beyond the scope of the available sample
data.
B. The prediction cannot be correct because there is not sufficient evidence of a linear correlation. The width in this case is beyond the scope of the
available sample data.
C. The prediction cannot be correct because a negative weight does not make sense and because there is not sufficient evidence of a linear correlation.
D. The prediction can be correct. There is nothing wrong with predicting the weight in this case.
Expert Solution
This question has been solved!
Explore an expertly crafted, step-by-step solution for a thorough understanding of key concepts.
Step by stepSolved in 2 steps with 2 images

Knowledge Booster
Similar questions
- Mar 23, 6:04:40 PM The box-and-whisker plot below represents some data set. What percentage of the data values are greater than 40? Answer: 60 25 50 75 Submit Answer 100 attempt 2 out of 2arrow_forwardYou wonder whether talking to plants keeps them from dying. You conduct a study in which you talk to one group of five plants and do not talk to a second group of five plants. After two weeks, you record whether each plant has lived or died. This assessment of plant health is a(n) _____ dependent variable, which means that the data can be analyzed using a(n) _____ test. a. nominal; parametric b. interval; parametric c. interval; nonparametric d. nominal; nonparametricarrow_forwardThe accompanying data table contains the prices and weights of the diamonds in 10 rings offered for sale. The prices are 4 carats an Xough d belo Data (Daund both The weight in carats and price in dollars for 10 diamond rings Weight 0.29 0.32 0.34 0.17 0.36 0.36 0.12 0.14 0.23 0.26 Price 924 881 1,039 445 1,073 1,034 120 320 665 733 Print Done - rings. ble.arrow_forward
- Construct a stem-and-leaf display of the data. What appears to be a representative strength value? Do the observations appear to be highly concentrated about the representative value or rather spread out? b. Does the display appear to be reasonably symmetric about a representative value, or would you describe its shape in some other way? c. Do there appear to be any outlying strength values? d. What proportion of strength observations in this sample exceed 10 MPa? The strength data for beams is attachedarrow_forwardTHIS o pts possible Submit Test ut ti The data represents the heights of eruptions by a geyser. Use the heights to construct a stemplot. Identify the two values that are closest to the middle when the data are sorted in order from lowest to highest Height of eruption (in.) 67 32 50 90 70 80 50 40 50 68 72 51 60 59 65 60 77 70 42 83 H. 臺 Which plot represents a stemplot of the data? A. O B. OC. 3 2 402 500019 6 00578 70027 803 3 2 4 001578 5 0027 6 003 70029 8 0 9 0 3029 4 017 5008 6 000 7005 8027 9 03 Gr 9 0 Identify the two values that are closest to the middle when the data are sorted in order from lowest to highest. The values closest to the middle are inches and inches. (Type whole numbers. Use ascending order.)arrow_forwardThe data represents the heights of eruptions by a geyser. Use the heights to construct a stemplot. Identify the two values that are closest to the middle when the data are sorted in order from lowest to highest. Height of eruption (in.) 69 37 50 90- 80 50 40 70 50 64 72 57 59 69 67 60 77 70 48 86 Which plot represents a stemplot of the data? A. 37 408 500079 604799 70027 806 90 B. 3 089 4079 5 004 6 007 7009 8 027 906 Identify the two values that are closest to the middle when the data are sorted in order from lowest to highest. The values closest to the middle are inches and inches. (Type whole numbers. Use ascending order.) ○ C. 37 4047799 50027 6006 70089 80 90arrow_forward
- Please do allarrow_forwardThe data represents the heights of eruptions by a geyser. Use the heights to construct a stemplot. Identify the two values that are closest to the middle when the data are sorted in order from lowest to highest. Height of eruption (in.) 65 31 50 90 80 50 40 70 67 73 52 50 54 68 63 60 Which plot represents a stemplot of the data? OA. 3 4023578 50037 6008 70034 80 90 B. 31 4 03 5 00024 603578 70037 808 90 Identify the two values that are closest to the middle when the data are sorted in order from lowest to highest. The values closest to the middle are ☐ inches and ☐ inches. (Type whole numbers. Use ascending order.) C. 3 034 4 025 5 007 6003 7 008 8 037 9 08 77 70 43 88arrow_forwardPlease see attached image. I need to calculate a weighted moving average where the weights should be 0.2, 0.3, and 0.5.arrow_forward
- Can you help me with d?arrow_forwardea surface temperature26.726.726.626.626.626.626.526.526.326.326.126.1Growth0.850.850.850.850.790.790.860.860.890.890.920.92 Make a scatterplot. Which is the explanatory variable? The plot shows a negative linear pattern. Explanatory Variable:arrow_forwardExQm Score Oata 76 69 64 75 70 80 90 86 77 79 82 96 51 64 95 6.2 76 65 68 74 Oc Mahe a box- and whiskar plot d alculus data Examarrow_forward
arrow_back_ios
SEE MORE QUESTIONS
arrow_forward_ios
Recommended textbooks for you
 MATLAB: An Introduction with ApplicationsStatisticsISBN:9781119256830Author:Amos GilatPublisher:John Wiley & Sons Inc
 Probability and Statistics for Engineering and th...StatisticsISBN:9781305251809Author:Jay L. DevorePublisher:Cengage Learning
 Statistics for The Behavioral Sciences (MindTap C...StatisticsISBN:9781305504912Author:Frederick J Gravetter, Larry B. WallnauPublisher:Cengage Learning
 Elementary Statistics: Picturing the World (7th E...StatisticsISBN:9780134683416Author:Ron Larson, Betsy FarberPublisher:PEARSON
 The Basic Practice of StatisticsStatisticsISBN:9781319042578Author:David S. Moore, William I. Notz, Michael A. FlignerPublisher:W. H. Freeman
 Introduction to the Practice of StatisticsStatisticsISBN:9781319013387Author:David S. Moore, George P. McCabe, Bruce A. CraigPublisher:W. H. Freeman

MATLAB: An Introduction with Applications
Statistics
ISBN:9781119256830
Author:Amos Gilat
Publisher:John Wiley & Sons Inc

Probability and Statistics for Engineering and th...
Statistics
ISBN:9781305251809
Author:Jay L. Devore
Publisher:Cengage Learning

Statistics for The Behavioral Sciences (MindTap C...
Statistics
ISBN:9781305504912
Author:Frederick J Gravetter, Larry B. Wallnau
Publisher:Cengage Learning

Elementary Statistics: Picturing the World (7th E...
Statistics
ISBN:9780134683416
Author:Ron Larson, Betsy Farber
Publisher:PEARSON

The Basic Practice of Statistics
Statistics
ISBN:9781319042578
Author:David S. Moore, William I. Notz, Michael A. Fligner
Publisher:W. H. Freeman

Introduction to the Practice of Statistics
Statistics
ISBN:9781319013387
Author:David S. Moore, George P. McCabe, Bruce A. Craig
Publisher:W. H. Freeman