
Human Anatomy & Physiology (11th Edition)
11th Edition
ISBN: 9780134580999
Author: Elaine N. Marieb, Katja N. Hoehn
Publisher: PEARSON
expand_more
expand_more
format_list_bulleted
Related questions
Concept explainers
Question
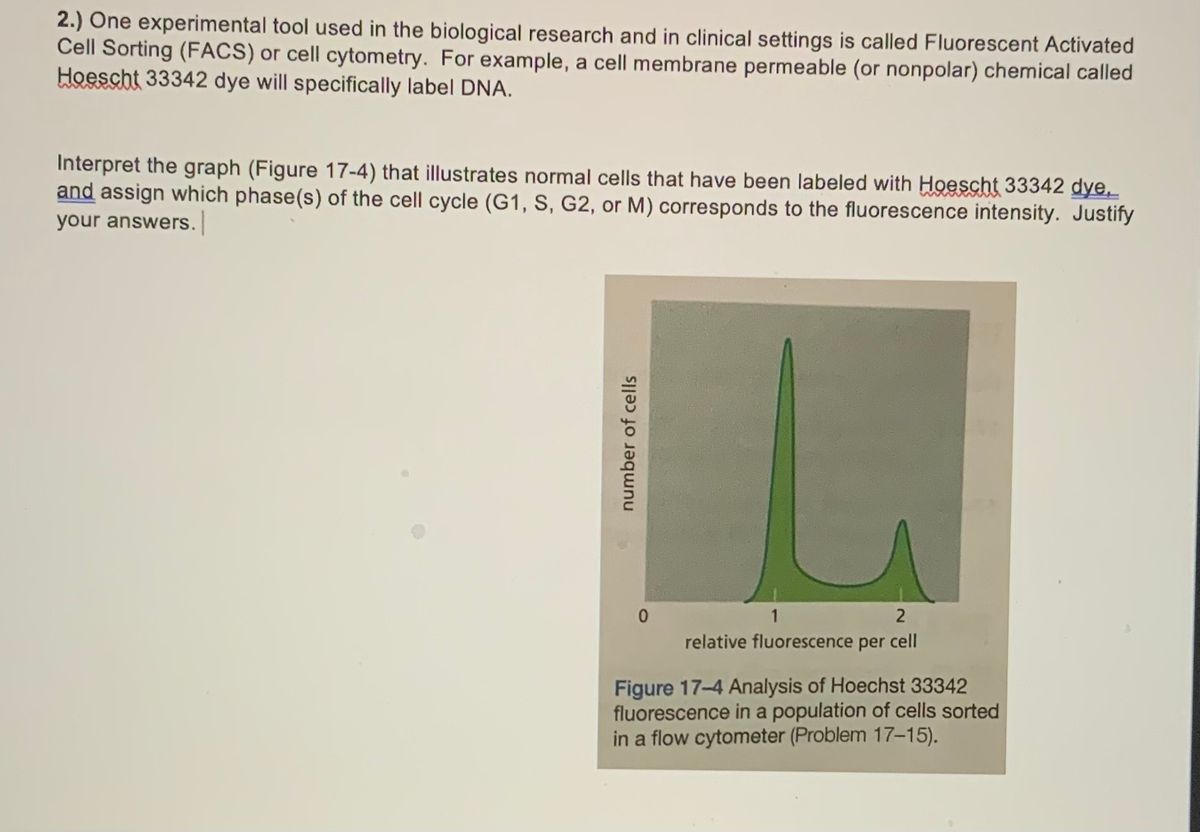

Transcribed Image Text:2.) One experimental tool used in the biological research and in clinical settings is called Fluorescent Activated
Cell Sorting (FACS) or cell cytometry. For example, a cell membrane permeable (or nonpolar) chemical called
Hoescht 33342 dye will specifically label DNA.
Interpret the graph (Figure 17-4) that illustrates normal cells that have been labeled with Hoescht 33342 dye,
and assign which phase(s) of the cell cycle (G1, S, G2, or M) corresponds to the fluorescence intensity. Justify
your answers.
1
relative fluorescence per cell
Figure 17-4 Analysis of Hoechst 33342
fluorescence in a population of cells sorted
in a flow cytometer (Problem 17-15).
number of cells
Expert Solution
This question has been solved!
Explore an expertly crafted, step-by-step solution for a thorough understanding of key concepts.

This is a popular solution

Trending nowThis is a popular solution!

Step by stepSolved in 2 steps

Knowledge Booster


Learn more about
Need a deep-dive on the concept behind this application? Look no further. Learn more about this topic, biology and related others by exploring similar questions and additional content below.Similar questions
- If a mad scientist hands you a cell culture with 100 cells that just entered g1. He needs to extract the MOST possible DNA from 100 cells. On top of that, he requires that the DNA cannot be condensed. To accomplish this goal he gives you a set of chemicals that will stop a cell in any part of the cell cycle you want. What part of the cell cycle would you stop the cell at, that matches those requirements?arrow_forwardWhat is the significance of the cell cycle control system and checkpoints? Explain step by step in your own words. [please make it simple]arrow_forwarda) Fluorescent probes such as DAPI are often used tostudy cells that are in the different phases of cell cycle.DAPI is a fluorescent stain that binds to DNA. The graphshows the variation in fluorescence intensity of humanskin cells that were sorted by FACs into 2 populationsbased on the amount of fluorescence.Which phase(s) of the cell cycle are population A in?Population B? Why did you pick those phases?arrow_forward
- To identify genes controlling the cell cycle in budding yeast, a genetic screen was carried out. In this screen, haploid yeast cells were exposed to a DNA damaging agent to introduce random mutations in the genome. By culturing cells at an elevated temperature (e.g. 37 degrees), where many mutated genes lose their function, scientists identified yeast mutants that showed growth defects and arrest at specific stages of the cell cycle (e.g. in mitosis with large buds). In this screen, mutants of the cyclin-dependent kinase were identified, but not mutants of cyclins. Explain the reason for this outcome.arrow_forwardA researcher, who is examining a sample of cells of the same types at different stages of cell division, isolates a group of cells in the sample that have 1.5 times the amount of DNA as cells at the G1 phase. Which of the following best describes this group of isolated cells? A B с D They are in the M phase of the cell cycle. They are between the G1 and the S phases in the cell cycle. They are in the S phase of the cell cycle. They are in the G2 phase of the cell cycle.arrow_forwardIn a dividing cell, the duplicated sets of chromosomes move along microtubules to opposite ends of the cell. How would you use an inhibitor to show that microtubules are essential for chromosome separation? What control treatment(s) would you use? What kind of cell junctions would you expect to find, and why, in a small animal where a chemical signal passes rapidly through cells to go from the head to the tail?arrow_forward
- In the experiment below, you have treated cells with different cancer drugs, stained them with propidium iodide, and analyzed them by flow cytometry. Which of the following histograms illustrates what you would expect to see in the event that the spindle assembly checkpoint is activated (focus on the solid line, the dotted line is normal cell cycle control)? 1. D 2. C 3. A 4.Barrow_forwardOne approach to studying the regulation of cell cycle progression (particularly in an era when genetic and molecular biology manipulations were less readily accomplished in mammalian cells) was to use treatments that induced cells to fuse and then monitor the behavior of the two nuclei in the resulting cell. The figure below depicts data from one such study. The investigators did preliminary work to produce populations of cells that were synchronized in various stages of the cell cycle (G1, S, or G2 in the examples shown below). They then fused the cells in different combinations and monitored subsequent events in each of the nuclei. For purposes of this question, we will pay particular attention to what occurred in the nucleus that came from the cell in G1. In one experiment (I), cells in the G1 and S phases were fused. That event caused the nucleus from the G1 cell to very quickly enter the S phase (sooner than it would otherwise have done so). In contrast, in a second experiment…arrow_forward1) Use your knowledge of the cell cycle to explain why onion root tip cells spend most of their time in this stage 2) complete table below of stages and reasoningarrow_forward
- A cell stops proliferating when treated with a chemical analog to fucoxanthin. When these cells are analyzed and compared to untreated cells according to the amount of DNA they contain using flow cytometry, the graphs in the figure below are obtained. Which of the following answers would NOT cause this result?arrow_forwardProgression through the cell cycle is dependent on both extra- and intracellular conditions. Consider the following conditions. Indicate which checkpoint (s) responds to that condition.a. The cell is large enough to divide.b. The DNA is completely copied during S phase.c. The cell is receiving positive cues from neighbors.d. The DNA is damaged.e. The cell has enough energy reserves to divide.f. Are all the sister chromatids correctly attached to spindle microtubules?arrow_forwardCan you draw 4th cell division of the adult stem cells. 1st and 2nd are symmetrically. 3rd and 4th are asymmetrically. What kind of cell is the product at the 4th division? Explain your reasoningarrow_forward
arrow_back_ios
arrow_forward_ios
Recommended textbooks for you
- Human Anatomy & Physiology (11th Edition)BiologyISBN:9780134580999Author:Elaine N. Marieb, Katja N. HoehnPublisher:PEARSON
 Biology 2eBiologyISBN:9781947172517Author:Matthew Douglas, Jung Choi, Mary Ann ClarkPublisher:OpenStax
 Anatomy & PhysiologyBiologyISBN:9781259398629Author:McKinley, Michael P., O'loughlin, Valerie Dean, Bidle, Theresa StouterPublisher:Mcgraw Hill Education,
  Molecular Biology of the Cell (Sixth Edition)BiologyISBN:9780815344322Author:Bruce Alberts, Alexander D. Johnson, Julian Lewis, David Morgan, Martin Raff, Keith Roberts, Peter WalterPublisher:W. W. Norton & Company
 Laboratory Manual For Human Anatomy & PhysiologyBiologyISBN:9781260159363Author:Martin, Terry R., Prentice-craver, CynthiaPublisher:McGraw-Hill Publishing Co.
 Inquiry Into Life (16th Edition)BiologyISBN:9781260231700Author:Sylvia S. Mader, Michael WindelspechtPublisher:McGraw Hill Education
Human Anatomy & Physiology (11th Edition)
Biology
ISBN:9780134580999
Author:Elaine N. Marieb, Katja N. Hoehn
Publisher:PEARSON
Biology 2e
Biology
ISBN:9781947172517
Author:Matthew Douglas, Jung Choi, Mary Ann Clark
Publisher:OpenStax
Anatomy & Physiology
Biology
ISBN:9781259398629
Author:McKinley, Michael P., O'loughlin, Valerie Dean, Bidle, Theresa Stouter
Publisher:Mcgraw Hill Education,
Molecular Biology of the Cell (Sixth Edition)
Biology
ISBN:9780815344322
Author:Bruce Alberts, Alexander D. Johnson, Julian Lewis, David Morgan, Martin Raff, Keith Roberts, Peter Walter
Publisher:W. W. Norton & Company
Laboratory Manual For Human Anatomy & Physiology
Biology
ISBN:9781260159363
Author:Martin, Terry R., Prentice-craver, Cynthia
Publisher:McGraw-Hill Publishing Co.
Inquiry Into Life (16th Edition)
Biology
ISBN:9781260231700
Author:Sylvia S. Mader, Michael Windelspecht
Publisher:McGraw Hill Education